The 2024 gold spot price decoupling
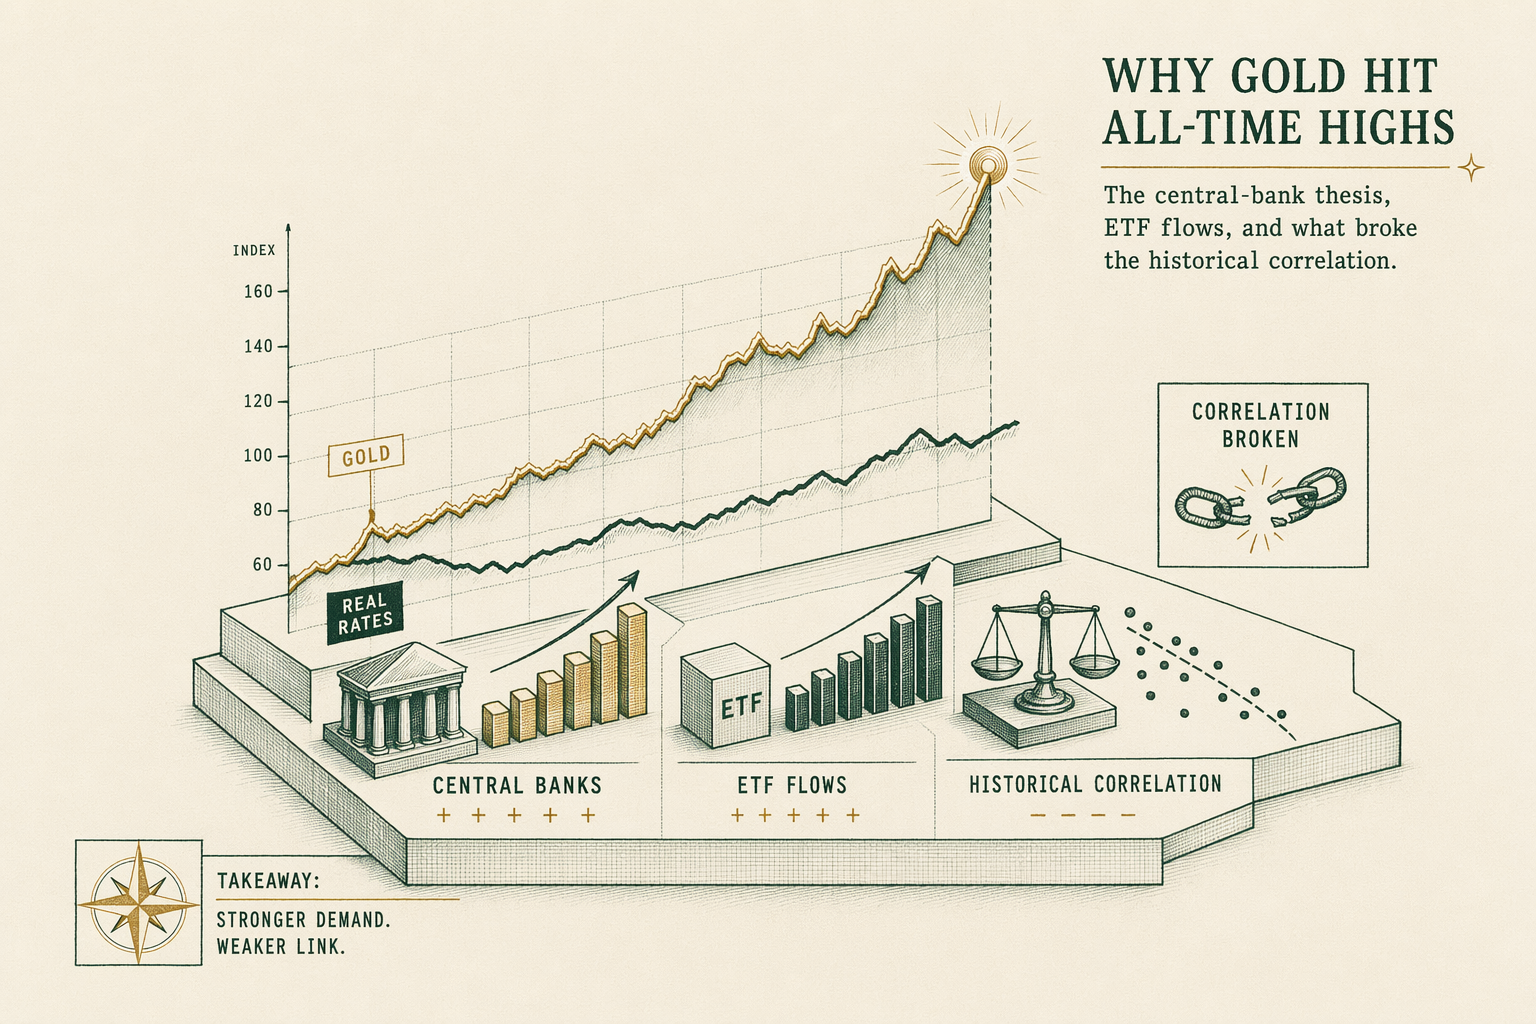
Why gold rallied to all-time highs in 2024 despite rising real US interest rates: the central-bank thesis, ETF flows, and what broke the historical correlation.
The historical gold/real-rate relationship
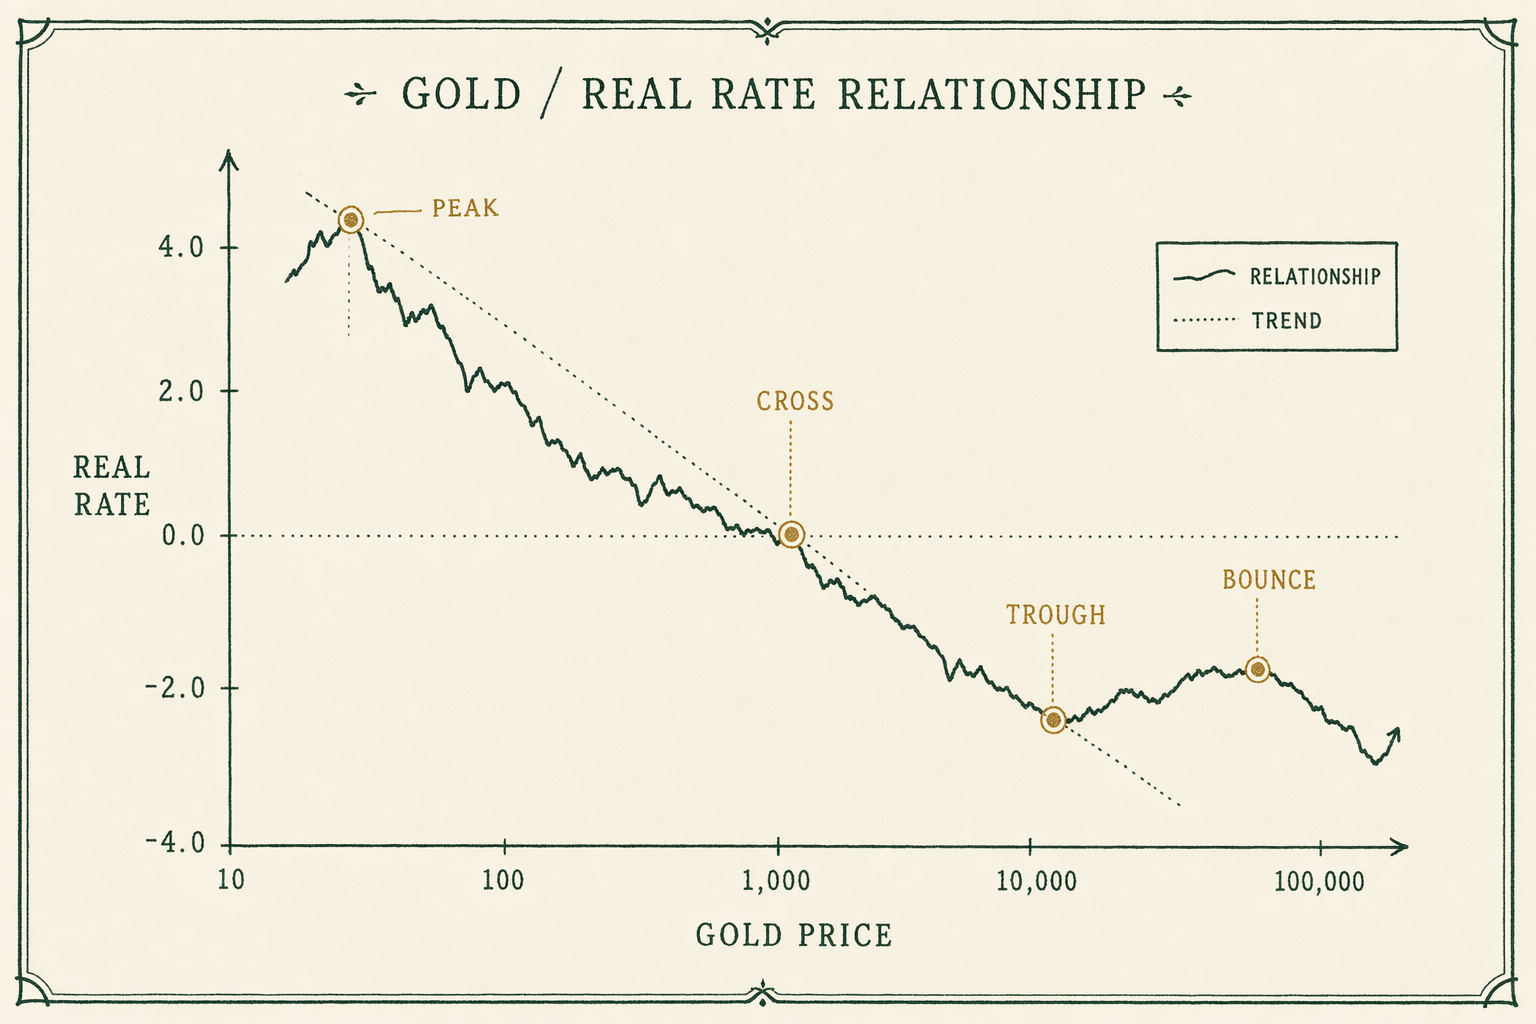
The 'gold versus real interest rates' model is the dominant academic framework for explaining gold-price behavior across the 1990-2020 window. The basic intuition: gold is a non-yielding asset (it does not pay interest or dividends), so its attractiveness relative to interest-bearing assets is inversely related to the real (inflation-adjusted) return available from those interest-bearing assets. When real rates fall (real yields on Treasuries decline), the opportunity cost of holding gold decreases, and gold typically rallies. When real rates rise, the opportunity cost increases, and gold typically struggles.
The model is supported by extensive academic literature. Erb and Harvey's 'The Golden Dilemma' (Financial Analysts Journal, 2013) provides one canonical reference. Baur and McDermott's 2010 work on gold's hedging properties offers complementary support. The Federal Reserve Bank of Chicago has published staff analyses applying the model to multi-decade datasets. The model's empirical fit across the 1990s-2010s is good — real-rate movements explain a meaningful fraction of variance in gold-price changes.
Operationally, the model captures the gold market under what we might call 'normal-regime' conditions where the marginal buyer of gold is a yield-sensitive investor (retail or institutional) trading off gold against bonds and equities on a relative-yield basis. In this regime, real-rate movements drive gold-price movements through the standard opportunity-cost mechanism.
The model has known limitations even within its strong-fit window. Stress episodes (2008 financial crisis, 2020 pandemic onset) saw gold-real-rate correlations briefly invert as forced-liquidation flows and dollar-funding-stress flows dominated. The 2024 episode is a different kind of departure: a sustained year-long divergence rather than a stress-driven multi-week inversion.
2024 — gold to all-time highs against the model
The 2024 LBMA Gold Price sequence: • December 29, 2023 PM fix: `$2,063/oz` • March 28, 2024 PM fix: `$2,214/oz` (Q1-end) • June 28, 2024 PM fix: `$2,330/oz` (Q2-end) • September 30, 2024 PM fix: `$2,634/oz` (Q3-end) • October 30, 2024 PM fix: `$2,789/oz` (multi-month peak) • December 31, 2024 PM fix: `$2,617/oz` (year-end)
Year-over-year LBMA Gold Price gain: from `$2,063` to `$2,617` — `+26.9%` nominal across 2024. The October peak of `$2,789` represented a `~35%` peak-to-trough year gain.
The 10-year US Treasury Inflation-Protected Securities real yield across the same window: • End-2023: `1.72%` • End-Q1-2024: `1.91%` • End-Q2-2024: `2.02%` • End-Q3-2024: `1.61%` • End-2024: `2.21%`
The traditional gold-vs-real-rates model would predict gold flat-to-down on real-yield movements of this magnitude. The Q1-2024 reading of `1.91%` and the Q2-2024 reading of `2.02%` were materially elevated against pre-2022 levels (when 10-year TIPS yields were broadly negative). The actual gold price moved in the opposite direction.
The mismatch is not subtle. Across the 2024 year, the model's predicted gold price (using the multi-decade-fitted relationship between TIPS yields and gold) would have been roughly flat or slightly down. The actual price was up `27%` nominal. The departure is large enough that it cannot be explained by parameter noise or short-window volatility. Something structural in the marginal-buyer profile changed.
Central bank buying as the explanatory variable
The most-cited explanatory variable in institutional analysis of the 2024 episode is central-bank net buying. Per the World Gold Council's tracking, central banks added net purchases at multi-decade-high pace across 2022, 2023, and into 2024 (covered in detail in /case-studies/central-bank-gold-buying-shift/). The 2024 full-year net central-bank buying reading came in at approximately `1,045` tonnes — the third-highest annual figure on record after 2022 and 2023.
The central-bank-buying thesis posits that a new marginal-buyer category — emerging-market central banks — added persistent gold demand insensitive to US real interest rates. Central banks buy gold for reasons including diversification, sanctions resilience, and geopolitical risk hedging. They are not making the gold-versus-Treasury-yield tradeoff that yield-sensitive private investors make. If the marginal buyer of gold across 2022-2024 was a central bank rather than a yield-sensitive private investor, the traditional gold-vs-real-rates relationship would weaken.
Quantitative support for the thesis: the central-bank net-buying pace post-2018 has been materially larger than the previous structural pace. From a pre-2018 baseline of roughly `400` tonnes/year to a 2022-2024 average of roughly `1,050` tonnes/year, the structural demand shift is `~650` tonnes/year — equivalent to roughly `15%` of total annual mine supply. This is a large enough flow to materially tilt the supply-demand balance.
Empirical-test support: research from multiple institutional analysts (most notably the World Gold Council's quarterly analytical notes and the major bullion-bank commodity-research desks) has shown that adding a central-bank-net-flow variable to gold-price regression models materially improves the fit across 2018-2024. The improvement is large enough to suggest the variable belongs in the structural model going forward.
Causation versus correlation caveat: descriptively, central-bank net buying correlates with elevated gold prices in 2022-2024. Whether the central-bank buying caused the price rally, or whether elevated gold prices motivated central-bank buying, or whether a third underlying variable (geopolitical risk perception, dollar-system trust) drove both, is not externally resolvable. The empirical record supports the variable as load-bearing in price-action explanation without conclusively establishing the causal direction.
ETF flow context
An important counter-data-point to the simple central-bank-thesis: physical-gold ETF flows across 2024 were broadly modest and at times outright negative. SPDR Gold Shares (GLD) and iShares Gold Trust (IAU) — the two largest US-listed physical-gold ETFs by AUM — experienced net outflows across much of H1-2024 even as gold prices were rallying.
GLD's gold holdings went from approximately `878` tonnes at end-2023 to approximately `873` tonnes at mid-2024 — essentially flat in holdings terms across the period when the price was up `~13%`. IAU showed a similar pattern. ETF flow data suggests that yield-sensitive private US-investor demand (which the ETF flow approximates) was not a structural buyer of the 2024 rally.
The ETF-outflow pattern in a rally is itself an unusual data point. In the 2009-2012 rally and again in the 2019-2020 rally, gold ETFs were net accumulating consistent with the rally. The 2024 pattern of ETF outflows-during-rally suggests the marginal buyer in 2024 was decidedly not the yield-sensitive US private investor.
Combined with the central-bank net-buying data, the ETF flow data tells a structural story: in 2024 the marginal gold buyer was an emerging-market central bank rather than a yield-sensitive US private investor or ETF, and the price rally was driven by the structural shift in marginal-buyer composition rather than by a change in the yield-sensitive-buyer's behavior in response to real rates.
Q4-2024 saw the ETF flow pattern shift; physical-gold ETFs began accumulating again as the price action continued to climb. The Q4 shift may reflect yield-sensitive US private investors capitulating to the multi-quarter price-action signal — a behavioral pattern documented in prior gold-rally cycles.
What this case study suggests about the model
Descriptively, the 2024 episode suggests three modifications to the traditional gold-price model.
First: the structural marginal-buyer profile matters more than the traditional model assumes. The 2024 data points to a regime where emerging-market central-bank buying is the marginal-flow driver, with the traditional yield-sensitive-private-investor channel as a secondary variable. A structural gold-price model accommodating this regime needs the central-bank-flow variable as a load-bearing input, not an afterthought.
Second: the relationship between gold and US real rates may be regime-dependent. Pre-2022, in a regime where emerging-market central banks were modest net buyers and yield-sensitive private investors were the dominant marginal channel, the gold-vs-real-rates relationship was a good fit. Post-2022, in a regime where emerging-market central-bank net buying has accelerated to multi-decade highs, the same relationship is much weaker. A regime-aware model would track which regime the market is in and apply different parameter sets accordingly.
Third: forward-looking price-prediction work should treat the central-bank-flow variable as itself uncertain. Whether the post-2018 central-bank buying regime continues, plateaus, or reverses is genuinely unknown. Survey data from the 2024 WGC Central Bank Gold Reserves Survey suggests continued buying intent — but reserve-management decisions have a way of changing without notice, and the underlying drivers (geopolitical-risk perception, sanctions-framework dynamics) themselves can shift. Any model that assumes a continuation of the 2022-2024 pace is making a regime-stability assumption that the data does not yet support.
We are explicit that BullionLens does not make forward-looking gold-price predictions — see /editorial-standards/. The episode does not justify a forward-looking call on either direction. It does justify model-level humility about the dominance of any specific historical relationship for forward inference.
What we still do not know
Three substantial unknowns remain about the 2024 episode even after the year-end data is in.
First: the actual size of unreported central-bank buying. Multiple commercial-research analyses suggest that actual emerging-market central-bank net buying may exceed officially-reported figures by a meaningful margin, with China the most-cited candidate for unreported buying. If actual buying is materially above reported buying, the structural-marginal-flow variable in any model is larger than the headline numbers suggest. The discrepancy is not externally resolvable.
Second: the persistence of the regime. Reserve-management decisions at central banks operate on long time horizons and respond to structural geopolitical-and-monetary factors that themselves shift slowly. Whether the 2022-2024 buying pace persists, plateaus, or reverses depends on factors (geopolitical-risk perception, sanctions-framework continuation, dollar-system trust, central-bank reserve-portfolio targets) that are themselves contingent. The 2024 WGC survey suggests buying intent persists; the actual buying-pace data over 2025-2027 will be the test.
Third: the eventual behavior of yield-sensitive private investors in the new regime. Q4-2024 saw physical-gold ETF flows turn positive after multiple quarters of outflows-during-rally. If yield-sensitive private investors accumulate alongside the continued central-bank buying, the combined flow could materially extend the rally. If yield-sensitive private investors remain net sellers (because real rates remain materially positive), the central-bank flow alone is the supporting variable. The interaction is itself uncertain.
These unknowns are not a criticism of the case-study analysis. They are an honest characterization of the limits of what the 2024 data can tell us about the 2025-2027 forward path. Descriptive analysis of what happened is feasible; forward-looking inference is constrained by genuine uncertainty.
Where to learn more
Primary data sources: the LBMA Gold Price daily PM fixings archive; the US Treasury Department TIPS yield archive (constant-maturity daily series); the World Gold Council's quarterly Gold Demand Trends reports for 2024 (Q1, Q2, Q3, Q4); the IMF International Financial Statistics for central-bank gold holdings data.
Academic and analytical treatments: the World Gold Council's quarterly analytical notes; Société Générale's commodity-research desk notes on gold-price drivers in 2024; HSBC Bank's institutional gold-research desk publications; Metals Focus' Gold Focus 2025 annual report (which covers 2024 in detail); the Federal Reserve Bank of Chicago and Federal Reserve Bank of New York staff analyses on gold-market structure.
For the broader model-level discussion: Erb, C.B. and Harvey, C.R. (2013), 'The Golden Dilemma,' Financial Analysts Journal 69(4); subsequent academic work updating the model in light of post-2020 data; the academic literature on commodity-pricing-model regime-shifts more broadly.

In plain English
In plain English: in 2024 gold rallied 27% to new all-time highs ($2,789 LBMA PM fix peak) even as US real interest rates rose. The traditional model — gold falls when real rates rise — predicted gold flat-to-down. The actual price action was decisively higher. The most-cited explanation is the central-bank net buying flow, which hit multi-decade highs in 2022-2024 (over 1,000 tonnes per year — about a quarter of all newly-mined gold). Notably, US physical-gold ETFs were NOT buying through most of 2024 — they were selling into the rally. The data points to a regime where emerging-market central banks have replaced yield-sensitive private investors as the marginal gold buyer. We do not predict where this goes. The episode does suggest the traditional gold-vs-real-rates model needs structural revision, not just parameter adjustment, to handle the post-2018 regime.
Frequently asked questions
-
Why is the 2024 price action interesting?
Historically, gold has shown an inverse correlation with US real (inflation-adjusted) interest rates — gold tends to do better when real rates are low or falling. In 2024, gold rallied to nominal all-time highs even as real US rates remained materially positive. The traditional model under-predicted the rally. -
Was central bank buying the cause?
It's the most cited candidate. Per multiple market analyses, central-bank net buying — especially from emerging-market central banks — added persistent demand that the model didn't include. Causation versus correlation is still being debated. -
Is BullionLens an investment adviser based on these case studies?
No. Case studies are historical event analyses, not recommendations. We are an editorial research desk. Consult a licensed adviser before applying any historical pattern to your own situation. -
How are the case studies sourced?
Primary financial-market data (LBMA fixings, COMEX volume, World Gold Council reports), SEC filings of involved entities, court records where applicable, and contemporary news coverage. Every claim of fact carries a citation in the body.
In plain English A historical event, not a forecast. Numbers are sourced from LBMA + WGC + primary regulatory filings.