Bullion market state — research desk
Editorial coverage of the bullion market: spot vs futures, gold-silver ratio, central-bank flows, mining supply, and ETF holdings. Historical data only.
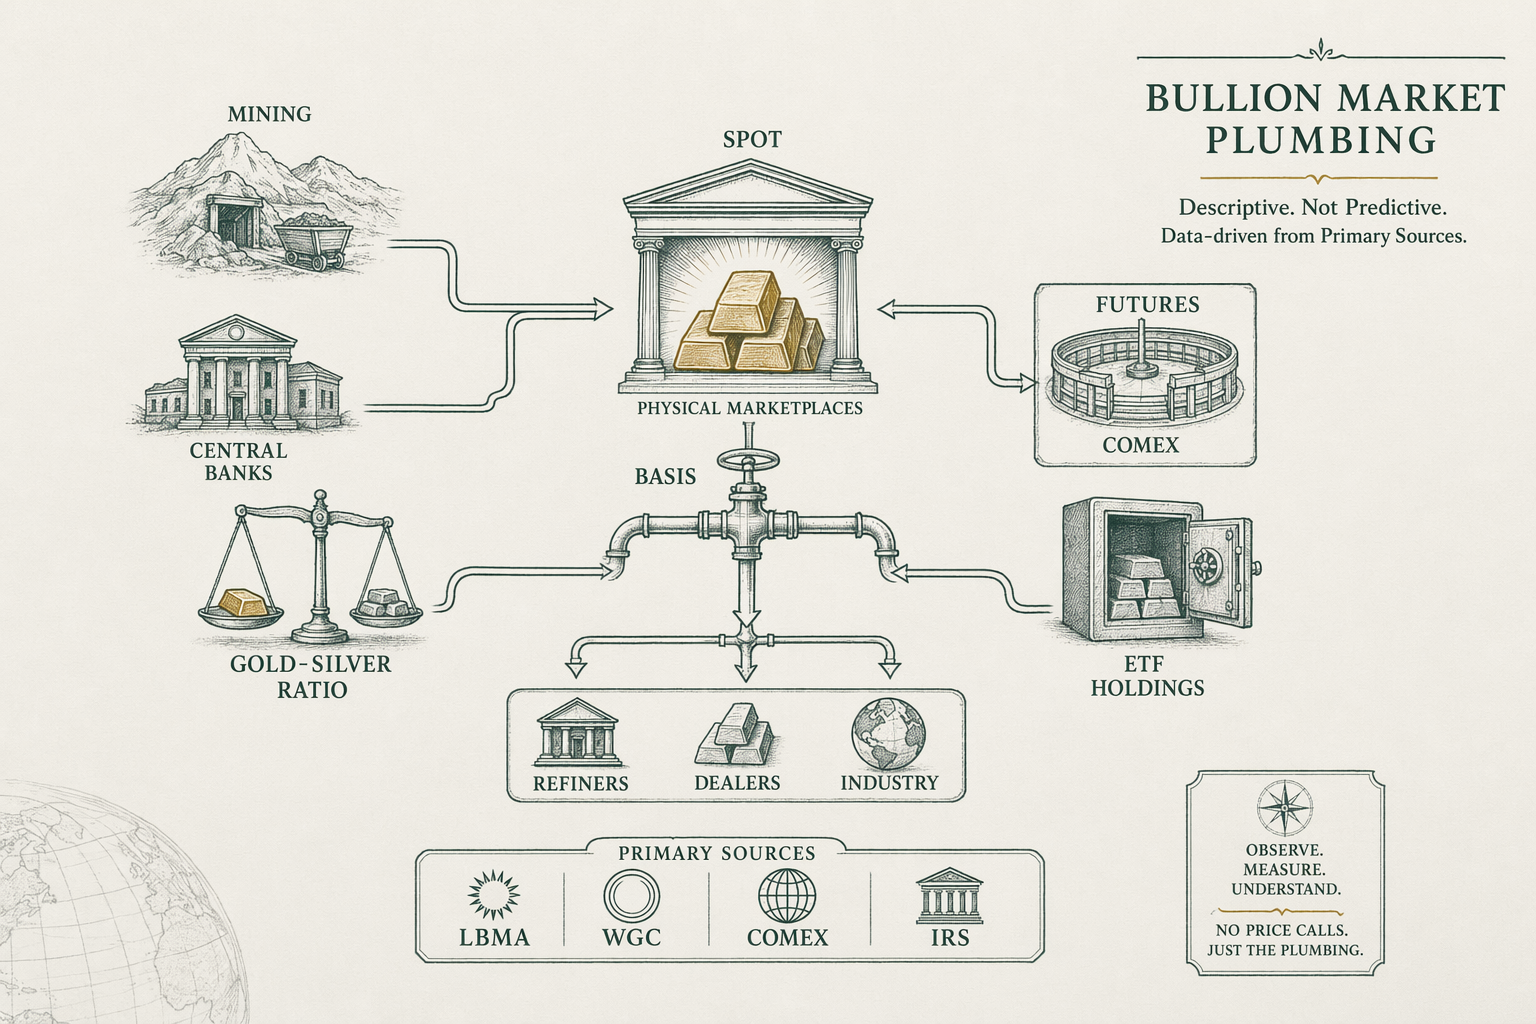
What this hub is and is not
This is the BullionLens research desk: a descriptive editorial view of the bullion market's structural plumbing, intended for readers who want to understand spot vs futures, the gold-silver ratio, central-bank flows, and ETF holdings without being sold a trading signal. The hub is descriptive. It is not predictive. The desk does not call the direction of the next price move, the next central-bank announcement, or the next supply event. Forward-looking calls are FINRA-flagged language for non-licensed publishers, and the desk treats the rule as binding.
What the hub does is point at the data sources that matter (LBMA fixings, World Gold Council annual reports, COMEX volume and open-interest data, IRS publications for tax-related questions) and explain what the data describes in plain language. Readers who want to act on the data take it to a licensed adviser. Readers who want to understand it stay here. The two activities are different and the hub treats them as different.
Spot, futures, and the basis
The 'spot price' of gold is the reference price for immediate delivery of one troy ounce of gold of specified fineness, set by global OTC trading. The LBMA Gold Price is the most widely cited benchmark: a twice-daily auction-based fix set by participating banks at `10:30 GMT` (the morning fix) and `15:00 GMT` (the afternoon fix). Continuous OTC trading between dealers and banks updates spot `24/5` in between the fixings; the fixings are the documentary benchmarks used in contracts and disclosures.
COMEX (the Commodity Exchange division of CME Group) is the largest gold futures venue. COMEX gold futures (symbol GC) trade in `100 oz` contracts and settle either by physical delivery against a COMEX-approved depository or by cash. Futures-trading volume vastly exceeds physical-delivery volume; most COMEX gold contracts close before delivery, with the price discovery feeding back into the spot reference through arbitrage.
The basis is the futures price minus the spot price for the same delivery month. Positive basis (contango) historically reflects storage costs and interest rates — holding physical gold in the meantime carries opportunity cost, so the future delivery commands a small premium. Negative basis (backwardation) is rare in gold but historically signals supply stress in the physical market when it appears. The basis is descriptive of the market's plumbing; it is not a trading signal on its own.

The gold-silver ratio in historical context
The gold-silver ratio is the current spot price of gold divided by the current spot price of silver, expressing how many ounces of silver buy one ounce of gold. The math is simple; the interpretation is not. Historically the ratio has ranged from roughly `15:1` (ancient and 19th-century bimetallic systems that legally tied gold and silver) to over `100:1` (modern peaks in the early `2020` silver liquidity stress).
The US Coinage Act of `1792` set the legal ratio at `15:1`. Through most of the bimetallic era the market ratio tracked within a narrow band of the legal benchmark. The breakdown came in the late `19th century` as silver supplies expanded faster than gold and the legal tie became economically unsustainable; the ratio drifted higher and the bimetallic system unraveled. In the `20th century` the ratio ranged roughly `30:1` to `80:1`, with episodic peaks during silver-specific stress events.
The modern long-run average sits somewhere around `60:1` to `70:1` depending on the window. The ratio briefly exceeded `120:1` in March `2020` amid silver liquidity stress that did not affect gold to the same degree. Practitioners cite the ratio as a relative-value indicator; the academic literature does not establish it as a predictive trading signal. Describe, do not predict.
Central-bank gold flows
Central banks shifted from net selling to net buying of gold over the past two decades, a structural pivot documented in the World Gold Council's annual Gold Demand Trends report. Through the `1990s` and early `2000s` European central banks were net sellers; the 1999 Washington Agreement (renewed `2004`, `2009`, `2014`) coordinated the selling to avoid disorderly markets. By the late `2010s` the dynamic had inverted, and central-bank net buying in `2022` and `2023` reached multi-decade highs.
The largest reported net buyers in recent years (per World Gold Council reporting) include the People's Bank of China, the National Bank of Poland, the Reserve Bank of India, the Central Bank of Turkey, and the Monetary Authority of Singapore. Unreported buying may differ; central banks are not uniformly transparent about reserve composition changes. The WGC's annual survey of central-bank reserve managers asks why they hold gold — top stated reasons in recent surveys include 'performance during times of crisis,' 'long-term store of value,' 'effective portfolio diversifier,' and 'no default risk,' with geopolitical-risk and sanctions-resilience answers rising materially after `2022`.
Central-bank net buying has correlated with elevated gold prices in `2022`-`2024`. The causal direction is contested in the literature — does central-bank buying push prices, do elevated prices reflect the same macro pressures that drive central-bank decisions, or both. We treat the data as structural context, not as a trading signal. See `/case-studies/central-bank-gold-buying-shift/` for the dated chronology.
Mining supply and recycling
Annual newly mined gold supply runs roughly `3,500` tonnes globally according to the World Gold Council's annual reporting. The major producing countries (China, Australia, Russia, the United States, Canada, Ghana, Mexico, Peru, Uzbekistan, South Africa) contribute the bulk; production has been broadly flat for over a decade as new mine grades decline and exploration discovers fewer new world-class deposits. The mining-supply growth rate is structurally low relative to historical commodities, which is a feature gold-as-monetary-asset analysis cites repeatedly.
Recycled gold (scrap from jewelry, industrial use, and electronics recovery) adds roughly another `1,200`-`1,300` tonnes annually to the supply side. Recycling supply is more price-sensitive than mining supply — at higher gold prices, more jewelry and industrial scrap comes to refineries. Total annual supply (mine plus recycled) typically lands in the `4,700`-`4,900` tonne range.
Demand splits roughly across jewelry (the largest single category historically), bar and coin investment, ETF flows (highly variable year to year), central-bank purchases, and technology / industrial use. The exact split shifts with each annual WGC report; the structural feature worth noting is that no single demand category dominates the way oil-driven demand dominates other commodities, which contributes to gold's relatively unique price-formation dynamics.
ETF holdings as a market signal
Gold-backed exchange-traded funds (notably SPDR Gold Shares (GLD) in the US, iShares Gold Trust (IAU), and similar vehicles globally) hold physical gold against shares. ETF holdings expand when investors buy more shares (creating new units against allocated metal in the vault) and contract when investors sell (with shares redeemed for cash equivalent and the vault gold released). Total global gold ETF holdings sit in the `3,000`-`3,500` tonne range in recent years, comparable to roughly one year of mine production.
Flow data on gold ETFs is published with relatively short delay (weekly or monthly depending on the fund) and is one of the more responsive structural indicators for institutional sentiment. Sustained ETF outflows during a rising gold-price environment have historically signaled that the price move is being driven by sources other than Western institutional buying (typically retail, central bank, or non-Western institutional flows). Sustained ETF inflows during a falling-price environment have similarly signaled cross-current dynamics.
ETF holdings are descriptive of where physical gold is held, not predictive of the next price move. Treat the data as one of several structural signals worth tracking alongside central-bank flows, COMEX positioning, and dealer-level retail flows.
What we cannot tell you
We cannot tell you what the gold price will do next week, next month, or next year. Forward-looking price calls are FINRA-flagged language for non-licensed publishers, and the desk refuses to make them. The future is not data we have, and the audience deserves a publisher willing to admit it.
We cannot tell you the right allocation percentage for your portfolio. Portfolio allocation is a personalized decision that depends on your time horizon, tax position, liquidity needs, and risk tolerance, all of which require a licensed adviser to evaluate properly. Practitioner-typical ranges of `5%`-`15%` as a portfolio-insurance sleeve appear repeatedly in the literature; the academic consensus on the right number is unsettled. Read `/for-portfolio-insurance/` for the editorial framing without a personalized recommendation.
We cannot tell you whether gold or silver is the 'better' bet at any given moment. The gold-silver ratio describes the relative pricing; it does not predict the direction of the next move. We can show you the historical range, the modern peaks, the bimetallic-era benchmarks. We cannot tell you what comes next.

Sources we use
The desk's standard reference sources for market-state coverage. LBMA daily gold price fixings (twice-daily, London Bullion Market Association). World Gold Council annual Gold Demand Trends report and quarterly updates. COMEX (CME Group) volume and open-interest data. IRS Publication `590-A` (Contributions to IRAs) and Publication `590-B` (Distributions from IRAs) for tax-related questions, plus the Form `1099-B` and Form `8300` documentation for reporting thresholds.
We do not cite secondary aggregators as authoritative. Aggregators are useful for finding sources; they are not the sources. Where a structural claim rests on a single primary source we say so explicitly in the body copy ('per the World Gold Council annual report'). Where independent corroboration exists we cite both. The audience gets to see the citation lattice and verify it.
For real-time spot pricing, the LBMA's published streams, COMEX, and established dealers (Kitco, APMEX, JM Bullion) are reasonable references — minor dispersion of `$0.50`-`$3` between sources on the same day is normal and reflects vendor markups and refresh-rate differences. For documented benchmarks in contracts and disclosures, the LBMA fixings remain the standard.
Want to talk this through? Book a 30-min research call →
Frequently asked questions
-
What is the 'spot price' of gold?
The reference price for immediate delivery of one troy ounce of gold of specified fineness, set by global OTC trading. The LBMA Gold Price (twice-daily fixing in London) is the most widely cited benchmark. -
What is the gold-silver ratio?
The number of ounces of silver required to buy one ounce of gold at current spot prices. Historically the ratio has ranged from roughly 15:1 (ancient bimetallic systems) to over 100:1 (modern peaks in 2020). It is a descriptive metric, not a trading signal. -
Why do central banks buy gold?
Reserve diversification, hedging against US dollar exposure, and (per the World Gold Council annual survey) increasingly stated reasons including geopolitical risk and sanctions resilience. Annual net central-bank purchases hit multi-decade highs in 2022 and 2023. -
Do you forecast prices?
No. Forward-looking price calls are FINRA-flagged language for non-licensed publishers. We describe historical data and structural drivers, not future paths.
In plain English We're an editorial desk. Educational only — talk to a licensed adviser before doing anything with retirement assets.