Gold's 2008 financial crisis price action
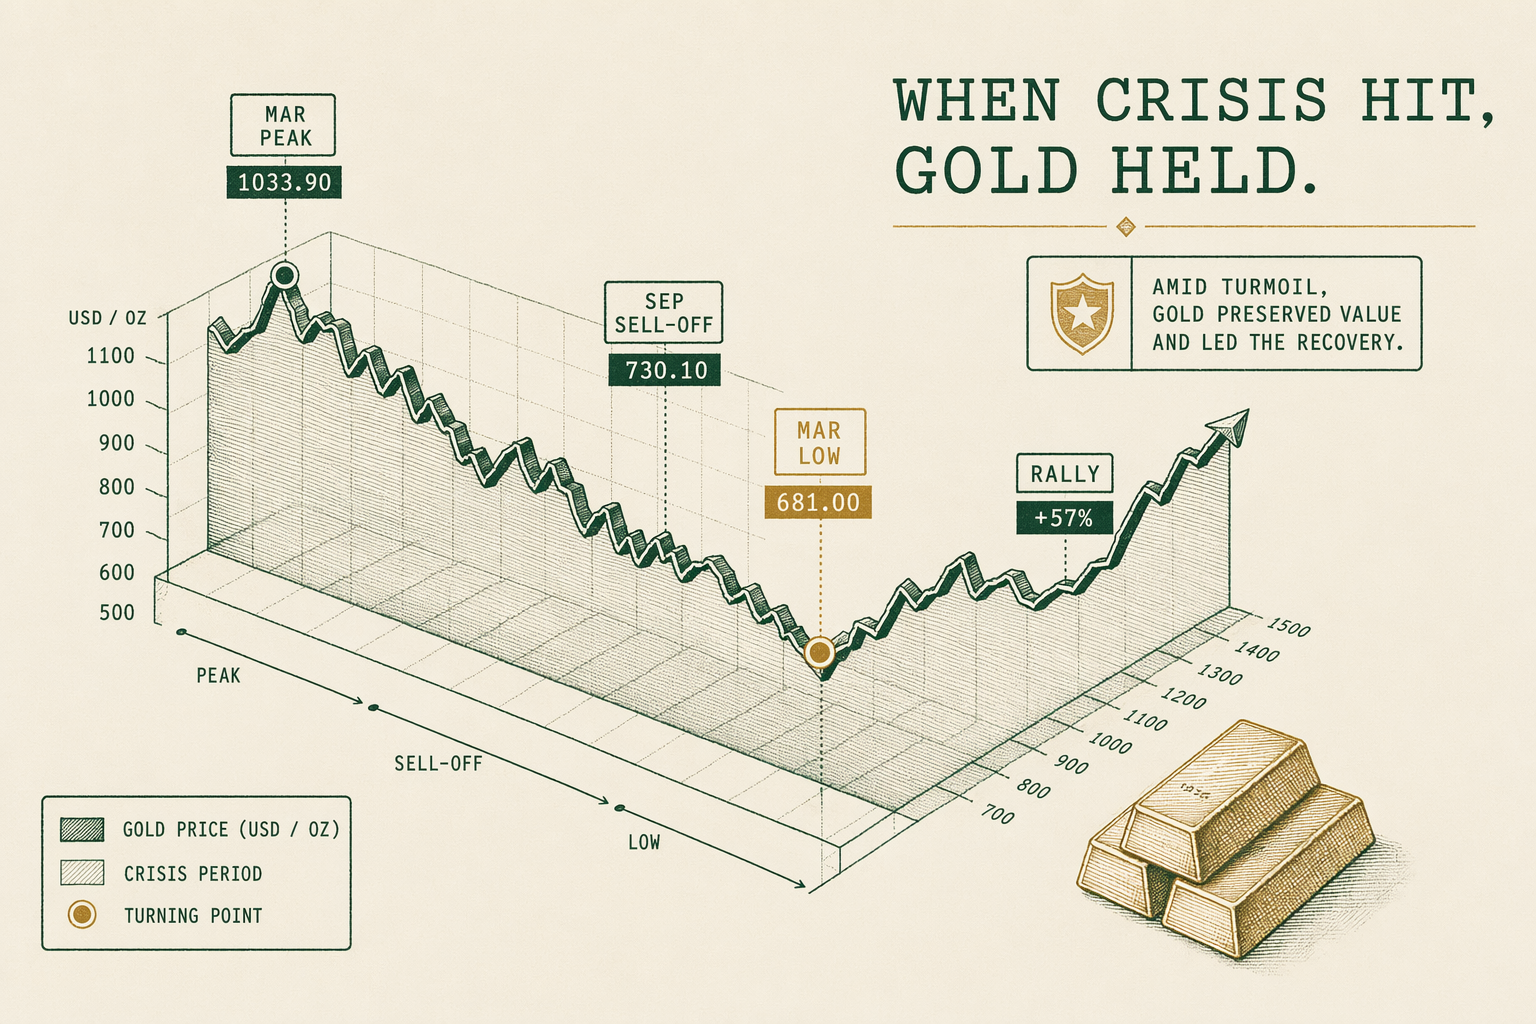
What gold did during the 2008 financial crisis: from the March 2008 peak through the September 2008 sell-off to the March 2009 low and the 2009-2011 rally.
Pre-crisis setup — March 2008 peak
Gold entered 2008 in the middle of a multi-year bull run that had begun in early 2001 from a starting LBMA fix near `$256/oz`. By March 17, 2008 — the date Bear Stearns was sold to JPMorgan Chase for $2 per share with the Federal Reserve providing $30 billion in financing against Bear's mortgage assets — gold reached an intraday high of `$1,032/oz` and an LBMA PM fix of `$1,011/oz`. This was the first time gold had crossed `$1,000` on a published LBMA fix.
The Bear Stearns episode functioned as a market-stress preview. Equities sold off across the prior week; credit-spread widening was material in mortgage-backed-securities markets and in financial-institution credit-default-swap pricing. Gold's move from roughly `$900` at the start of March to `$1,011` on March 17 reflected initial safe-haven demand alongside continued dollar weakness against the euro (the EUR/USD reached an all-time high near 1.59 in mid-March 2008).
Following the Bear Stearns episode, market stress subsided through April and May 2008. The Federal Reserve's `$30` billion backstop on Bear's mortgage book and the Treasury's coordinated response calmed immediate credit concerns. Gold drifted lower from the March peak as the immediate-stress trade unwound, settling in a `$900` to `$950/oz` range through May and June.
By mid-summer 2008 gold was trading near `$900/oz` — well off the March peak but still well above pre-2007 levels. The market was assessing whether the credit cycle had bottomed (the dominant retail-investor view by mid-2008) or whether more material stress was ahead (the dominant institutional-credit-desk view through the same period).
September 2008 — Lehman week sell-off
September 2008 broke the assessment in favor of the institutional-credit-desk view. The sequence of events:
September 7, 2008 — Federal takeover of Fannie Mae and Freddie Mac. The Federal Housing Finance Agency placed both GSEs in conservatorship. Gold rose from `$795` on Friday September 5 to `$815` on Monday September 8 — a modest move reflecting the partial-resolution character of the action.
September 14-15, 2008 — Lehman Brothers Holdings Inc filed Chapter 11 bankruptcy in the early hours of September 15 after the Federal Reserve declined to extend a bailout. The bankruptcy was the largest in US history at that time, with `$639` billion in assets. The same weekend, Merrill Lynch was sold to Bank of America for `$50` billion in stock. AIG required emergency Federal Reserve financing the following Tuesday.
Gold's immediate Lehman-week behavior was striking. Friday September 12 LBMA PM fix: `$764/oz`. Monday September 15 LBMA PM fix: `$781/oz`. Tuesday September 16 LBMA PM fix: `$782/oz`. Wednesday September 17 LBMA PM fix: `$852/oz`. Thursday September 18 LBMA PM fix: `$876/oz`. The Wednesday-to-Thursday jump of roughly `$95/oz` over two days is among the largest two-day moves in modern LBMA-fixing history and reflected genuine safe-haven flow.
The Lehman-week peak in gold's safe-haven response came on Thursday September 18 with the LBMA PM fix at `$876`. From that peak, gold did not establish a sustained higher high until February 2009. The forced-liquidation cycle that defined the next six weeks took the price down materially before the safe-haven thesis re-asserted itself.
October 2008 — the liquidity squeeze
The October 2008 sequence was dominated by forced-liquidation flows. Hedge funds facing redemption requests sold liquid assets to raise cash. Money-market funds dealing with the September 16 Reserve Primary Fund 'breaking the buck' event tightened their commercial-paper holdings. Institutional investors holding mark-to-market mandates faced margin calls and de-leveraging requirements. Gold, which is highly liquid and can be sold in size quickly, was sold by holders who would have preferred to hold but were operationally compelled to raise cash.
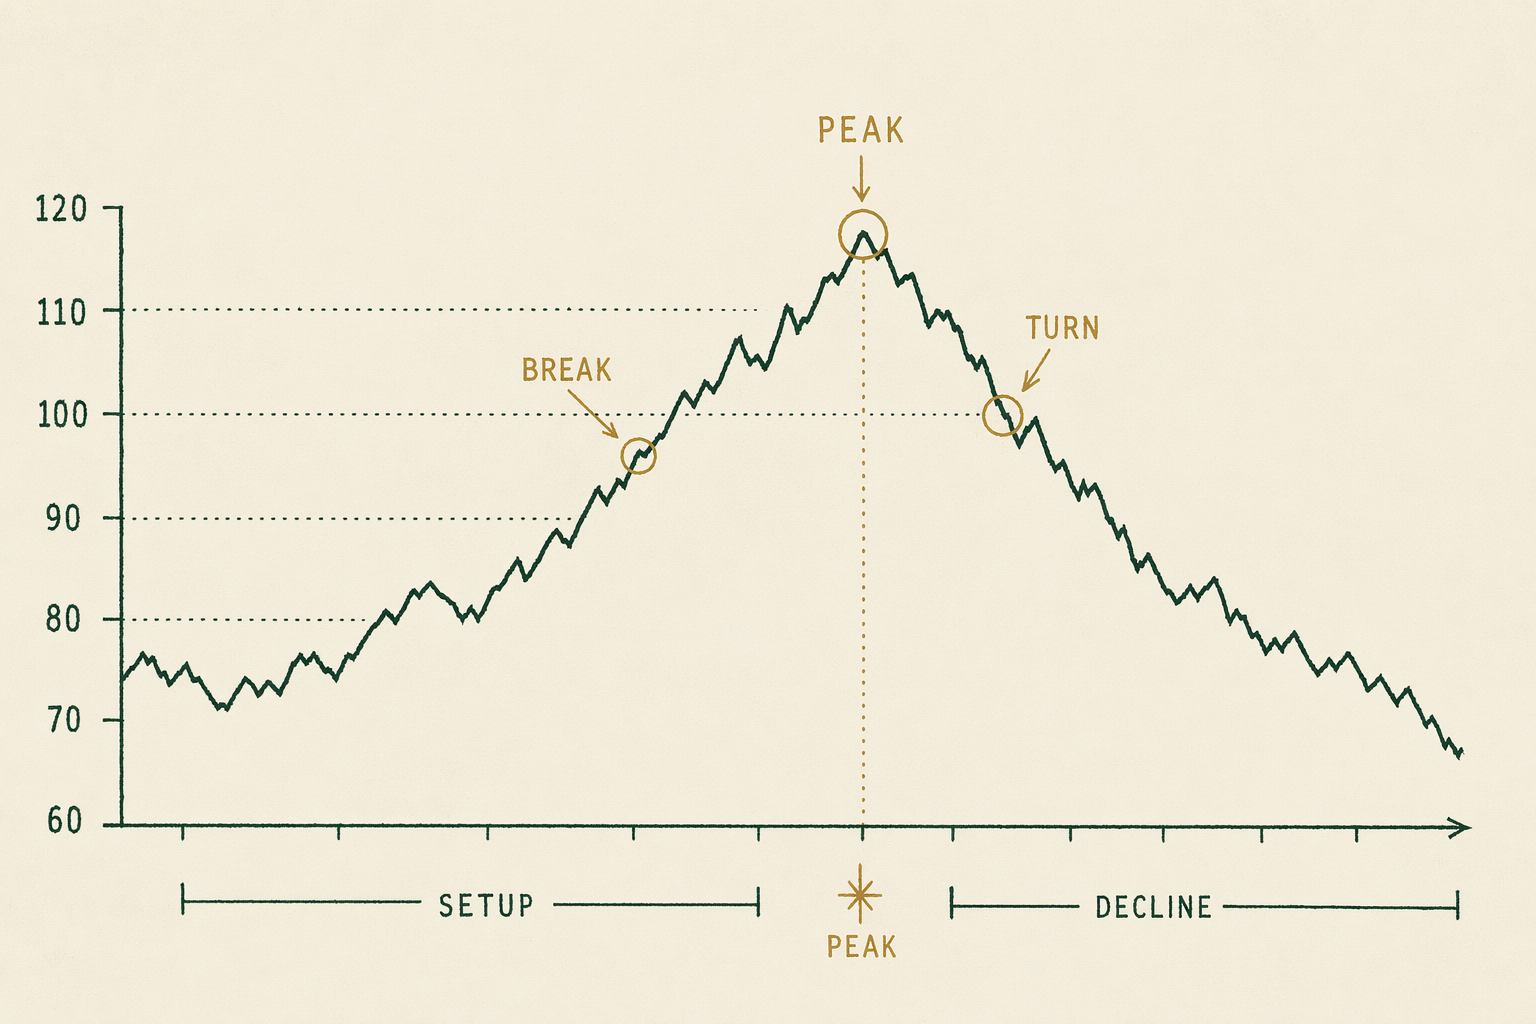
The S&P 500 fell from 1,255 on September 19 to 848 on November 20 — a `32%` decline in two months. The VIX hit `80` in late October, an all-time high reading. Treasury yields collapsed (the 10-year Treasury yield fell from `3.87%` at end-September to `3.0%` by end-October) as flight-to-Treasuries intensified.
Gold's October 2008 LBMA fixings: • October 1: `$880` • October 10: `$846` • October 17: `$789` • October 24: `$729` • October 31: `$724`
From the September 18 peak at `$876` to the October 24 fix at `$729`, gold fell roughly `17%` in five weeks. This drawdown coincided with the worst weeks of the equity-market crisis. The 'gold rises in a crisis' narrative was not operational during this window. Gold was being sold by the same forced-liquidation flows that were selling everything else.
The dollar's behavior during October 2008 was a partial explanation. The DXY dollar index rose from `78.5` at end-September to `87` by end-October — a `~10%` move higher in dollar strength reflecting global dollar-funding stress in the LIBOR-OIS spread, the Fed swap lines, and the cross-currency basis. Gold priced in USD fell while gold priced in EUR (which was being devalued against the dollar) fell less. The crisis was as much about dollar funding stress as about asset-side weakness.
November 2008 to March 2009 — the bottom
Gold bottomed in the November 2008 timeframe at around `$700/oz` and then traded in a range between `$700` and `$900` through the worst of the equity-market damage. The October-21 LBMA PM fix at `$728` was followed by a range-bound period as the forced-liquidation flow exhausted itself.
The November 2008 LBMA PM fix range: low `$711` (November 12), high `$821` (November 24). The early-November Federal Reserve coordinated central-bank action (the November 5 Fed funds rate cut to 1.0%, the QE1 announcement on November 25 of agency mortgage-backed securities purchases up to $500 billion) marked the institutional response that began to stabilize the broader financial system.
December 2008 and January 2009 saw gold consolidate in the `$750` to `$900` range. The S&P 500 made a second-leg lower in February-March 2009 to its ultimate March 6, 2009 closing low of 676 — but gold did not make a corresponding new low. By March 2009 gold was trading in the `$900` to `$960` range, having decoupled from the equity-market path lower.
From peak (`$1,011` LBMA PM fix on March 17, 2008) to trough (`$711` LBMA PM fix on November 12, 2008), gold experienced a maximum drawdown of `29.7%` over 8 months. From the same March 2008 peak to the August 2011 ultimate high (`$1,896`), gold gained `87.5%` over 41 months.
Both numbers describe what happened. The drawdown was real and meaningful for any holder who needed liquidity during November 2008. The eventual rally was real and meaningful for any holder who held through the drawdown. Neither narrative ('gold collapses in crisis' or 'gold rises in crisis') captures both halves of the sequence. The path was non-monotonic.
March 2009 to August 2011 — the rally
From the late-2008 bottom, gold rallied for nearly three years through to the August 2011 peak at `$1,896/oz`. The driving mechanics were a multi-vector pattern combining institutional crisis-response factors, central-bank policy, and structural demand shifts.
Federal Reserve policy: the November 2008 announcement of QE1 (`$500 billion` initial agency MBS, expanded to `$1.25 trillion` by March 2009 with additional `$300 billion` of long-dated Treasury purchases) established the post-crisis Federal Reserve balance-sheet expansion that defined the next half-decade of US monetary policy. Real interest rates fell sharply across the curve. The 10-year Treasury Inflation-Protected Securities yield went from positive to deeply negative across 2009-2012 — a structural condition academically associated with elevated gold prices.
Central-bank net selling pause: 1999-Washington-Agreement-era European central-bank net selling effectively ended in this period. Emerging-market central banks (India, China — though Chinese purchases were not yet visible in published reporting at this stage) began the multi-year accumulation pattern that intensified through the 2010s and 2020s.
ETF flows: SPDR Gold Shares (GLD) and iShares Gold Trust (IAU), the two largest US-listed physical-gold ETFs, accumulated gold holdings on a multi-year tilt as retail and institutional investors used the ETF channel for gold-price exposure. GLD's gold holdings reached a then-record `1,300+` tonnes in mid-2010.
Multi-year LBMA PM fixing trajectory: `$869` December 31, 2008. `$1,096` December 31, 2009. `$1,405` December 31, 2010. `$1,575` December 31, 2011 (the year-end fix; the August 2011 peak was higher at `$1,896`). From the late-2008 bottom at `$711` to the August 2011 peak at `$1,896`, gold gained `166%` over 33 months.
Lessons from the sequence
Three operational lessons from the 2008 sequence are applicable to current buyers — descriptively, not as predictions of future crisis behavior.
Lesson one: gold's response to a systemic stress event is path-dependent. The 2008 path was peak (March 2008) → modest decline → safe-haven rally (Lehman week, September 2008) → forced-liquidation drawdown (October-November 2008) → bottom → multi-year rally. Any single-frame snapshot ('what did gold do during the crisis?') is incomplete. Retail readers consistently underestimate the magnitude of the October-November 2008 drawdown when characterizing gold's crisis behavior.
Lesson two: gold's correlation to other assets varies by stress regime. In normal markets gold has near-zero correlation to the S&P 500 and modest positive correlation to other safe-haven assets. In the worst weeks of October 2008 the correlations rose toward 1 across all liquid assets — gold sold off in correlation with everything else during the forced-liquidation cycle. This correlation-spike-in-stress pattern is documented across other crisis episodes and is a property of liquid assets generally, not a unique gold feature.
Lesson three: the timeframe of the analysis matters more than any specific event. Gold over the 41 months from March 2008 to August 2011 gained `87.5%` — a substantial diversification contribution for any portfolio that held the position through the period. Gold over the 8-month window of March 2008 to November 2008 lost `29.7%` — a meaningful drag on the same portfolio if measured at that single point. The portfolio-allocation conclusion depends on the timeframe.
Practical implication for current buyers: a portfolio sleeve in gold should be sized at a position that the holder can hold through a `30%` peak-to-trough drawdown without operational compulsion to sell. If the position must be liquidated during a stress event for non-investment reasons (margin call, redemption, operational liquidity need), the position is at risk of being sold at the bottom of the path rather than realizing the eventual rally. The /tools/portfolio-allocation-research/ analysis covers the historical drawdown impact of different allocation sizes.
Where to learn more
Primary sources for further reading on the 2008 episode: the Financial Crisis Inquiry Commission Report (2011), the Federal Reserve's published meeting minutes for September-November 2008 (released after the 5-year disclosure delay), and the LBMA Gold Price daily fixings archive for the underlying price data. The Bank for International Settlements' annual report for 2008-2009 contains the institutional credit-cycle context.
Academic treatments worth reading: Baur and McDermott's 2010 work on 'Is gold a safe haven? International evidence' (Journal of Banking & Finance), which examines gold's correlation behavior during stress periods including 2008; Reboredo's 2013 work on extreme dependencies between gold and other assets; and the McKinsey Global Institute's 'Money in motion' tracking work covering institutional flows during the crisis.
World Gold Council's annual demand-trends reports for 2008-2011 provide the demand-side picture — gold investment-demand surged through this window as ETF flows and bar-and-coin retail demand both accelerated.
For the broader institutional history: Adam Tooze's 'Crashed: How a Decade of Financial Crises Changed the World' (2018) is the canonical narrative history of the period, with gold-market mentions in the context of the broader credit-and-currency dynamics. Andrew Ross Sorkin's 'Too Big to Fail' (2009) covers the Lehman week from the institutional-financial-sector perspective.
In plain English
In plain English: in 2008 gold did rise during the worst of the crisis — but not until after a 30% drawdown during the actual worst weeks. Gold peaked at $1,011 in March 2008, fell to $711 in November 2008 (during the same weeks that the S&P 500 cratered), then rallied to $1,896 by August 2011. If you'd needed to sell gold for cash during October-November 2008 you'd have sold near the bottom. If you'd held through the drawdown you'd have nearly doubled your money over three years. The 'gold rises in a crisis' narrative is broadly correct over multi-year windows but masks the short-term drawdown during forced-selling episodes. Any portfolio sleeve in gold should be sized to be holdable through a 30% drawdown without compulsion to sell.
Frequently asked questions
-
Did gold rise during the 2008 crisis?
Yes — but not linearly. Gold peaked near $1,011 in March 2008, sold off to roughly $700 in October-November 2008 as forced selling and dollar strength dominated, then rallied to over $1,900 by August 2011. -
Why did gold drop during the worst weeks of the crisis?
Forced liquidation. Institutions facing margin calls and redemptions sold liquid assets including gold to raise cash. Gold's sharpest 2008 drawdown happened during the worst liquidity stress. -
What is the lesson?
Gold's behavior in a crisis is path-dependent. The 'gold rises in a crisis' narrative is broadly correct over multi-year windows but masks meaningful short-term drawdowns during forced-selling episodes. -
Is BullionLens an investment adviser based on these case studies?
No. Case studies are historical event analyses, not recommendations. We are an editorial research desk. Consult a licensed adviser before applying any historical pattern to your own situation.
In plain English A historical event, not a forecast. Numbers are sourced from LBMA + WGC + primary regulatory filings.