Is gold an inflation hedge?
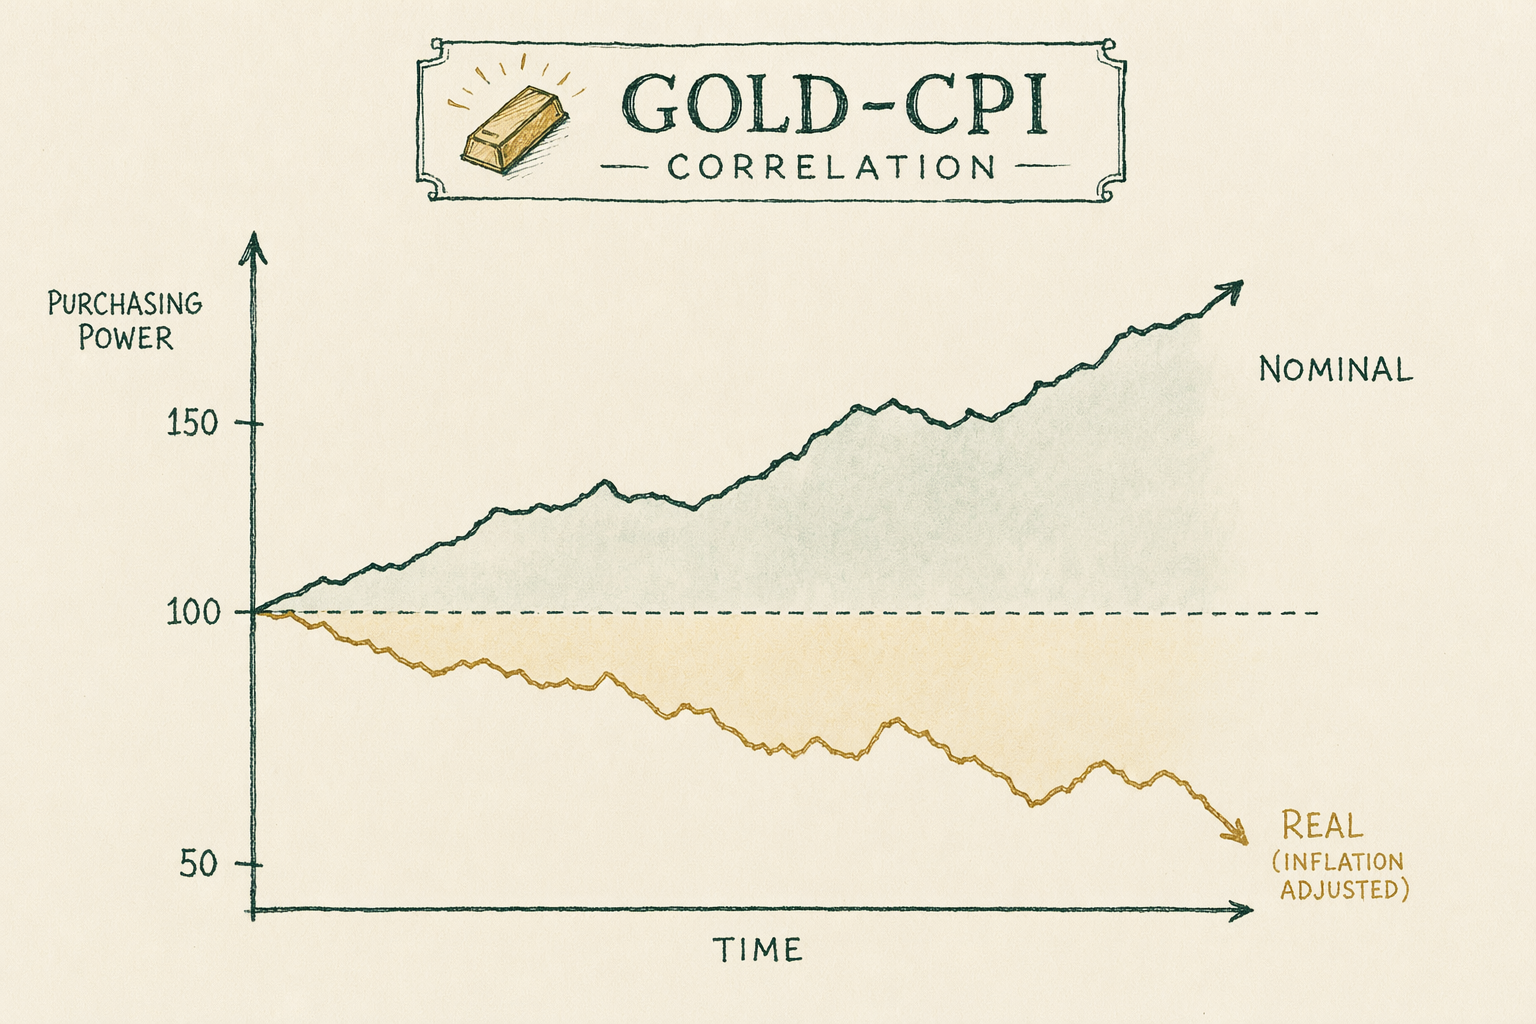
Historical correlation between gold prices and US CPI: the 1970s pattern, the 1980s-1990s decoupling, and what the data actually shows.
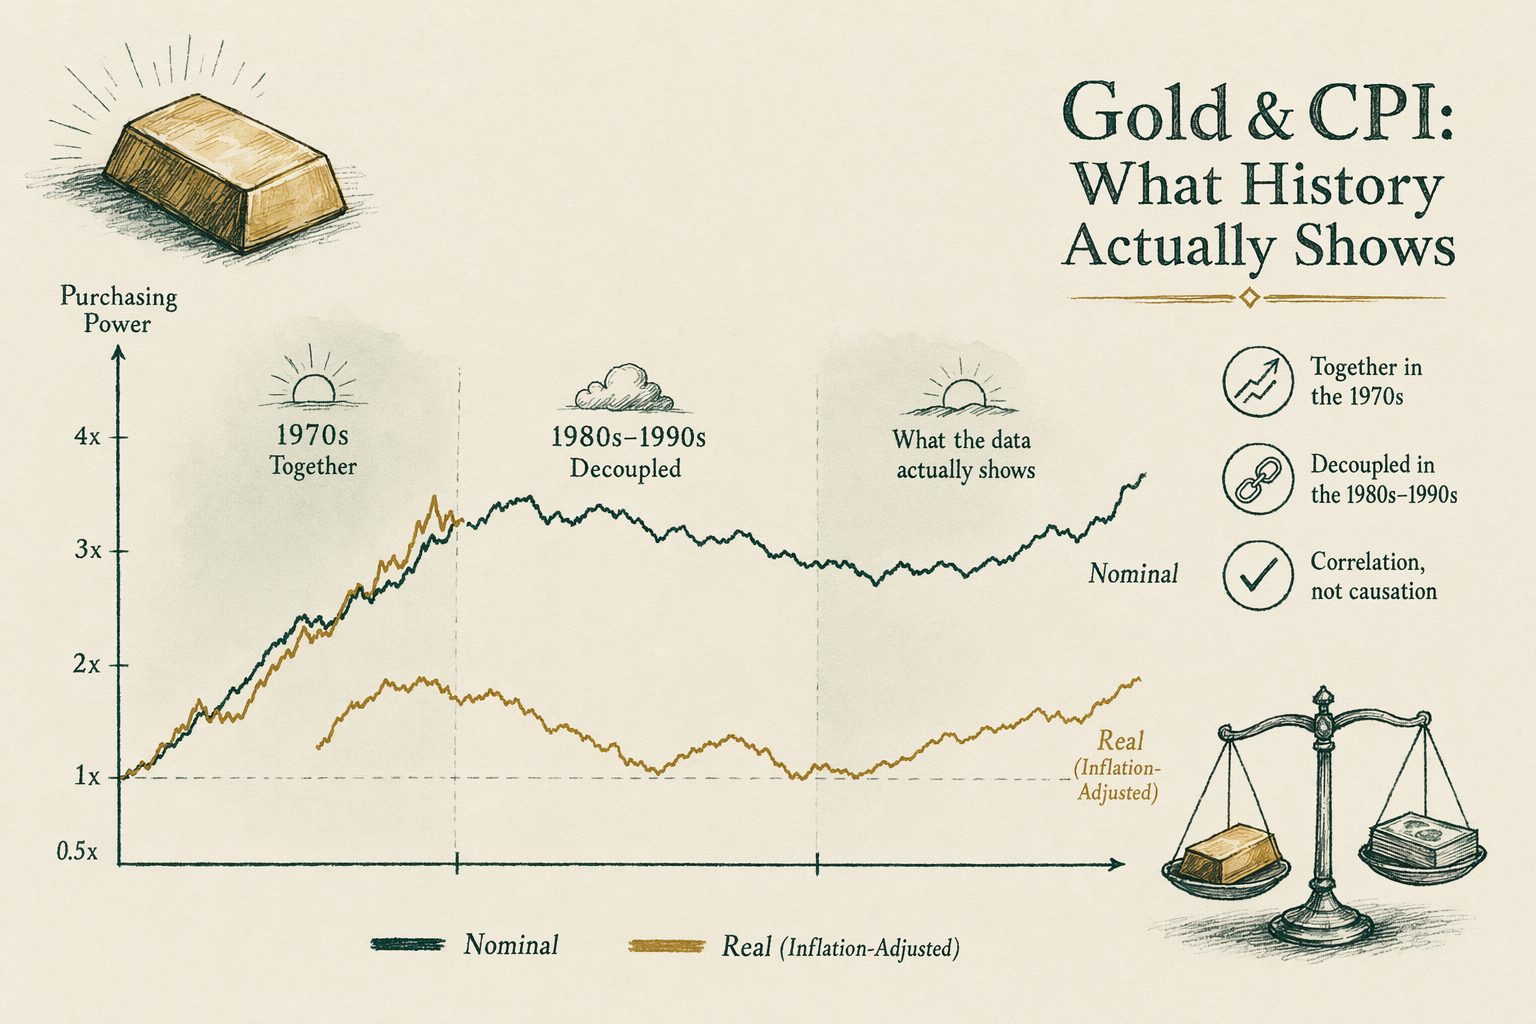
The 1970s gold-CPI correlation
The 1970s is the strongest historical case for gold as an inflation hedge. President Nixon ended the gold-dollar convertibility on August 15, 1971, and the gold price was freed to float. From the official `$35/oz` peg, gold rose to approximately `$184/oz` by year-end 1974, then continued upward to peak at approximately `$850/oz` in January 1980 (LBMA London PM fix).
Over the same period, US CPI rose from approximately `40.5` (January 1971) to approximately `77.8` (January 1980), a cumulative inflation of approximately `92%`. The gold price rose roughly `24x` in nominal terms over the same period — dramatically outpacing inflation.
The 1970s gold-CPI relationship is the data the inflation-hedge claim is built on. Several caveats matter for interpretation: the period starts from a fixed-price baseline (`$35/oz` was below the free-market price even in 1971); the bull market was amplified by oil-shock-driven inflation expectations; and the peak in January 1980 was followed by a 20-year bear market. The 1970s data shows gold can dramatically outpace inflation; it does not show that gold consistently does so.
1980s-2000s decoupling
From the January 1980 peak of approximately `$850/oz`, gold entered a multi-decade bear market. The LBMA gold price reached its 20-year low at approximately `$252/oz` in August 1999 — a `70%` nominal decline from the 1980 peak.
Over the same period, US CPI continued to rise. From January 1980 (`77.8`) to August 1999 (`166.7`), CPI roughly doubled. Cumulative inflation over this period: approximately `114%`. The gold price fell `70%` in nominal terms while CPI more than doubled. In real (inflation-adjusted) terms, the gold price collapse over this period was even more severe.
The 1980-2000 period is the strongest historical case AGAINST gold as an inflation hedge. A buyer purchasing gold at the 1980 peak as an inflation hedge would have seen their position lose `70%` nominally and substantially more in real terms over the subsequent two decades. The CPI rose; gold did not.
Several factors are cited in the academic literature for the 1980-2000 decoupling: declining inflation expectations after Paul Volcker's interest-rate increases broke the 1970s inflation cycle; rising real interest rates; central-bank gold selling (the Bank of England's notorious 1999 sale at the price bottom); and the displacement of gold by financial-asset alternatives.
2009-2024 mixed signals
The post-2008 period has produced mixed signals on the gold-CPI relationship. The gold price rose from approximately `$870/oz` in early 2008 to a peak of approximately `$1,895/oz` in September 2011 — a `+118%` move during a period when US CPI rose approximately `9%`. Gold dramatically outpaced inflation in that window.
From the September 2011 peak, gold entered a multi-year correction to approximately `$1,060/oz` by late 2015 — a `44%` decline over four years during which CPI continued to rise approximately `5%`. Gold decoupled from CPI in the other direction.
From 2016 through 2024, the gold price recovered to new nominal highs above `$2,000/oz` and then beyond, with the move accelerating in 2024-2025 to above `$2,700/oz` at certain peaks. CPI over the same period rose meaningfully, particularly in the 2021-2023 period when measured CPI inflation reached `7-9%` year-over-year. Gold rose alongside CPI in some periods; in others (particularly 2022) gold lagged equity-market and bond-market responses to inflation. The relationship is not mechanical.
Short horizon vs long horizon
Year-to-year correlation between gold price changes and CPI changes is weak. Statistical analysis (running rolling correlations over 1- to 5-year windows) generally finds weak or even slightly negative correlations between monthly gold returns and monthly CPI changes — not the result one would expect if gold were a tight inflation hedge.
Long-horizon (multi-decade) analysis tells a different story. Over 50-year horizons (`1975-2025`), the gold price has roughly kept pace with US CPI in cumulative terms, though with substantial periods of underperformance and outperformance along the way. Over longer horizons (multi-century, drawing on the Roy Jastram and similar historical research), gold has maintained purchasing power across very long periods despite the multi-decade variations.
The honest summary: gold is a poor short-term inflation hedge (yearly correlation weak); a mixed medium-term hedge (5-10 year periods can go either way); and a reasonable long-horizon store of value (multi-decade purchasing-power preservation, with high variance along the way). The marketing claim of "inflation hedge" implies more reliability than the data supports at the time horizons most retail buyers care about.
What the academic literature says
Erb and Harvey (2013), *The Golden Dilemma*, is the most-cited modern academic paper on gold's inflation-hedging properties. The authors find weak short-term inflation-hedging properties and observe that gold's purchasing power varies substantially across periods. They note that the gold/CPI ratio has historically reverted to a long-run mean of approximately `3.4`, with significant deviations from that mean in both directions.
Jastram (1977 and later editions), *The Golden Constant*, examines gold's purchasing power across multi-century horizons in the UK and US. The work finds remarkable long-horizon purchasing-power preservation with substantial deviation around the long-run trend.
Baur and McDermott (2010) examine gold's role as a "safe haven" — distinct from inflation hedge — and find evidence that gold returns are positively correlated with periods of equity-market stress, particularly during crises. This is a different question from inflation hedging and the results are stronger.
World Gold Council research consistently emphasizes gold's long-horizon store-of-value role and notes the weak short-term CPI correlation. The WGC framing is industry-promotional; the underlying empirical findings on the weak short-term correlation are consistent across the academic literature.
The consensus reading: gold has long-horizon store-of-value properties; it has weak short-term inflation-hedging properties; it has somewhat stronger crisis-period safe-haven properties. Marketing claims that flatten these distinctions into "gold is an inflation hedge" oversimplify the data.
Want to talk this through? Book a 30-min research call →
Frequently asked questions
-
Did gold protect against 1970s inflation?
Yes — gold rose from roughly $35/oz (when convertibility ended in 1971) to over $800/oz by January 1980, a period when US CPI rose materially. The 1970s is the strongest historical case for gold as inflation hedge. -
Has gold tracked inflation since?
Less reliably. From 1980 to 2000, gold traded sideways to down in nominal terms despite cumulative inflation. The 2000s and 2020s showed renewed gold strength, but the relationship is not mechanical. -
What does academic research say?
Empirical research generally finds gold to be a weak short-term inflation hedge but a stronger long-horizon store of value (multi-decade). Erb and Harvey (2013) is a frequently-cited paper on this. -
Where does BullionLens get its data on this topic?
Primary sources cited in the article. For market data we lean on the LBMA daily fixings, COMEX volume reports, IRS publications, SEC filings, and the World Gold Council's annual reports. We do not cite secondary aggregators as authority.
In plain English We're an editorial desk. Educational only — talk to a licensed adviser before doing anything with retirement assets.