Gold as portfolio insurance
Editorial guide to using gold as a portfolio insurance sleeve: historical drawdown analysis, correlation context, and common 5-15% allocation frameworks.
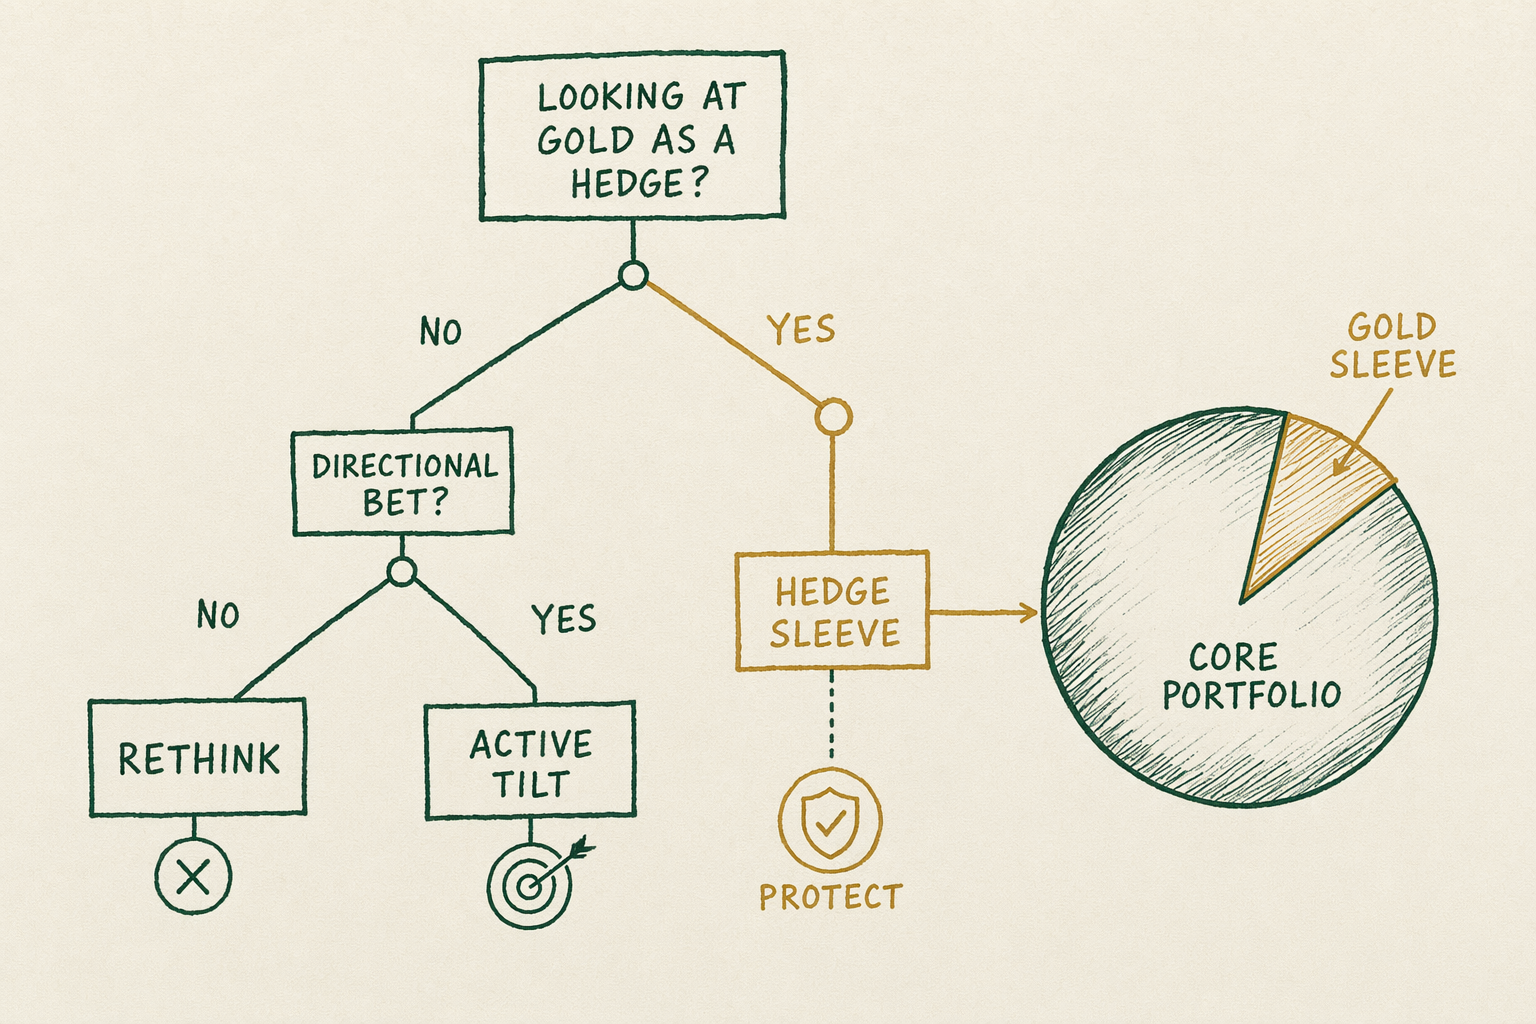
If you are looking at gold as a hedge, not as a directional bet
If you are reading this guide, you have probably already decided that gold is not a return-maximizing asset over multi-decade horizons in your portfolio. The historical real return on physical gold is well below the historical real return on diversified equity, and the academic literature on long-run asset-class returns is largely consistent on the point. What gold has done historically — and what the audience for this guide is interested in — is reduce peak-to-trough drawdown during specific equity bear markets, occasionally meaningfully so. That is a different value proposition than 'return-maximizing.' It is the 'insurance sleeve' framing.
This guide walks the historical record on what a `5%`, `10%`, or `15%` gold allocation has done to portfolio drawdowns during documented bear markets, the correlation context that determines when gold helps and when it does not, the practitioner-typical sizing frameworks, and the explicit acknowledgment of what insurance gold does not do. The desk does not deliver a personalized allocation percentage; that question belongs with a licensed adviser who knows your time horizon, your tax position, and your liquidity needs. What the desk does is walk the historical evidence.
What this guide covers
Five sections. First, the 'insurance sleeve' framing — why gold is plausible as an insurance-style allocation rather than as a return-maximizing allocation. Second, the historical drawdown record at `5%`, `10%`, and `15%` allocations against a `60/40` baseline, with the specific bear markets and the specific outcomes. Third, the correlation context — gold and equities historically run at low to slightly negative correlation, but the correlation is regime-dependent and `2022` saw the rare instance of both falling together.
Fourth, the practitioner-typical sizing: where the `5%`-`15%` band comes from in the literature and the wealth-management practice, and the framing that distinguishes an insurance allocation from a directional bet. Fifth, the explicit limits of what gold does as insurance — the asset does not insure against every drawdown, the policy expiration is structural (gold rises in some crises, not others), and the correlation regime can shift.
Every section is descriptive and historical. There are no forward-looking calls. Forward-looking calls are FINRA-flagged language for non-licensed publishers and the desk does not make them. Each section ends with the licensed-professional pointer for personalized questions.
The 'insurance sleeve' framing
Insurance, in the asset-allocation sense, is an asset that loses value in expected scenarios in exchange for gaining value in tail scenarios. Cash is the simplest example — cash earns less than equities in expected scenarios but holds its nominal value when equities draw down severely. Long Treasuries play a similar role in some regimes. Gold is the third candidate that appears repeatedly in the literature, with a different correlation profile than cash or bonds: gold can rise meaningfully in some tail scenarios, particularly those involving currency-debasement concerns or large-scale geopolitical disruption.
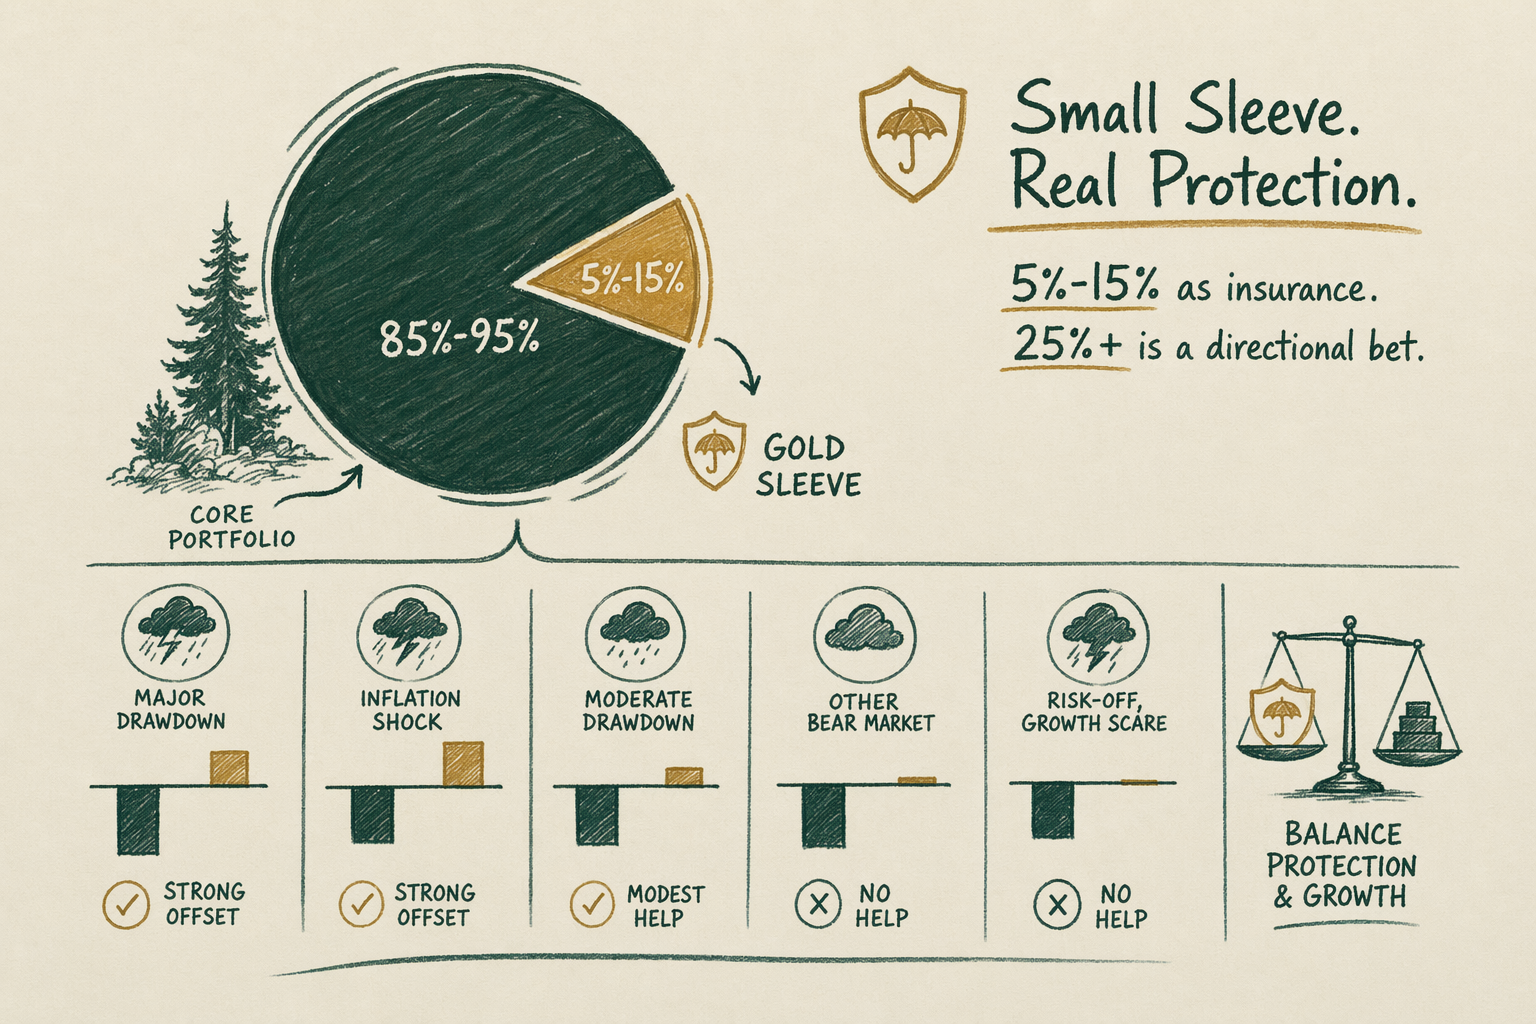
The framing matters because it sets the expectation correctly. An insurance allocation is not expected to outperform the rest of the portfolio in normal markets; it is expected to underperform. The value of the allocation is the optionality during the rare scenarios when the rest of the portfolio is taking a deep drawdown. Buying gold expecting it to keep pace with diversified equities in a long bull market is a misreading of the asset's historical behavior; expecting it to provide some cushion in a `2008`-style or `1973`-style bear market is consistent with the historical record.
This framing also distinguishes an 'insurance allocation' from a 'directional bet.' At `5%`-`15%` of a portfolio, the allocation cannot drive overall returns even if gold appreciates dramatically; the math does not work because the rest of the portfolio is too large. At `25%`-`50%`, the position is large enough to dominate portfolio returns and is properly thought of as a directional bet on gold-favorable scenarios. The two framings imply different risk-tolerance, different conviction levels, and different conversations with the adviser.
Historical drawdown impact at 5%, 10%, 15% allocations
Consider the `2008` financial crisis as a documented bear market. From the equity peak in October `2007` to the trough in March `2009`, the S&P 500 fell approximately `57%` peak-to-trough. The LBMA spot price of gold over the same window moved roughly flat at the lows (with some volatility), and over the broader 18-month window from September `2008` to March `2010` rose from `$869` to `$1,212`, a `+39.5%` nominal move. A `60/40` portfolio (`60%` S&P 500, `40%` US aggregate bonds) lost approximately `30%` peak-to-trough in this window. A `60/40` portfolio with a `10%` gold sleeve carved from the bond allocation (`60/30/10`) lost approximately `25%`-`27%` peak-to-trough in the same window — a modest but real reduction in the drawdown.
Consider the `1973-1975` stagflation bear market. From the equity peak in January `1973` to the trough in October `1974`, the S&P 500 lost approximately `48%` peak-to-trough. Gold over the same window rose dramatically — from roughly `$65/oz` to `$185/oz`, a `+185%` nominal move (in part reflecting the unwinding of the Bretton Woods gold-dollar peg, a structural shift that does not have a clean modern analog). A portfolio with a meaningful gold sleeve during this window saw substantial offset against the equity drawdown.
Consider `2022`. From the equity peak in January `2022` to the trough in October `2022`, the S&P 500 lost approximately `25%` peak-to-trough. Gold over the same window moved roughly sideways with some volatility, and US aggregate bonds had their worst calendar year in modern history (down roughly `-13%`). A `60/40` portfolio lost more in `2022` than in most equity-only bear markets because the bond hedge failed. A `60/30/10` portfolio with a gold sleeve carved from the bond allocation outperformed `60/40` modestly because the gold sleeve held up better than the bonds did. The `2022` case is an unusual one and worth studying carefully: the relationship between gold and equities was not the relationship between gold and bonds, and the diversification math depended on which asset you carved the gold from.
Correlation context
The headline statistic — gold and equities have run at low to slightly-negative correlation over the long run — masks a more complex regime structure. During quiet bull markets gold tends to drift, sometimes flat or slightly down, while equities rise; the correlation appears mildly negative. During acute equity bear markets driven by financial-system stress (`2008`, the `1987` crash), gold has historically risen materially, deepening the negative correlation precisely when it matters. During slow-growth bear markets driven by stagflation (`1973-1975`), gold has rallied alongside equity drawdowns in spectacular fashion.
The exceptions matter. The `2022` bear market saw gold and equities both decline modestly while bonds declined sharply; the gold-equity correlation was mildly positive but small. Some commodity-driven bear markets (oil-driven episodes, broader commodity-supply stress) have seen gold and equities move together in confused fashion. The long-run statistical correlation between gold and equities is roughly zero with wide regime-dependent variation — describing this as 'gold is a hedge' is too simple, and describing it as 'gold does not hedge' is too simple in the opposite direction.
The academic literature (Erb and Harvey `2013` on the long-run real return on gold, Baur and McDermott `2010` on safe-haven properties, World Gold Council ongoing research) is broadly consistent on the framing: gold is a partial hedge in some regimes, not a guaranteed hedge in all regimes, and the correlation regime can shift unpredictably. An allocation justified by the partial-hedge framing is defensible; an allocation justified by 'gold is uncorrelated with everything' overstates the case.
Practical sizing
Common practitioner sizing places `5%`-`15%` of a portfolio as an 'insurance sleeve' allocation. The lower end (`5%`) is large enough to matter at the margin in deep drawdowns but small enough to be a rounding error in normal markets. The upper end (`15%`) is large enough to provide meaningful drawdown cushioning but small enough that the position is still dominated by the rest of the portfolio in expected scenarios.
Above `15%` the framing shifts from 'insurance' toward 'directional bet.' At `25%`, gold appreciation or depreciation starts to drive overall portfolio returns; the position is making a meaningful claim on gold-favorable regimes versus gold-unfavorable regimes. Above `25%`, the position is properly thought of as a directional bet on a specific macro thesis, with all the conviction-level and risk-tolerance implications that come with directional bets.
Below `5%` the position is too small to matter in any reasonable drawdown scenario. A `1%` gold allocation in a `60/40` portfolio reduces a `30%` portfolio drawdown by roughly nothing detectable. If the diversification thesis is the reason for the position, the position size needs to be large enough to actually diversify. If it is below that threshold, the position is editorial in nature rather than analytical, and is better thought of as 'I want to own some gold' than as a portfolio-construction decision.
What insurance gold does and does not do
What gold has historically done as an insurance sleeve. Provided partial drawdown offset in financial-crisis episodes (`2008` being the canonical recent example). Provided substantial drawdown offset in stagflation episodes (`1973-1975` being the canonical historical example). Provided some diversification against bond-led drawdowns (`2022` being the recent counter-intuitive example where gold helped relative to bonds, even as both declined modestly).
What gold has not historically done. Provided drawdown offset in every bear market — there are documented episodes where gold and equities have both fallen, including parts of `2022` and certain commodity-supply-stress episodes. Generated long-run real returns competitive with diversified equity — the real return on gold over a multi-decade horizon is materially below the real return on equities. Predicted the direction of the next move, the next crisis, the next inflation regime, or the next currency event — gold's historical role is descriptive, not predictive.
The honest summary is that gold has historically functioned as a partial, regime-dependent hedge with meaningful upside in specific tail scenarios and modest opportunity cost in expected scenarios. That description supports an insurance-sleeve allocation. It does not support either of the two extreme framings — 'gold always works' or 'gold never works.' Both are wrong; the regime structure is more interesting than either oversimplification.
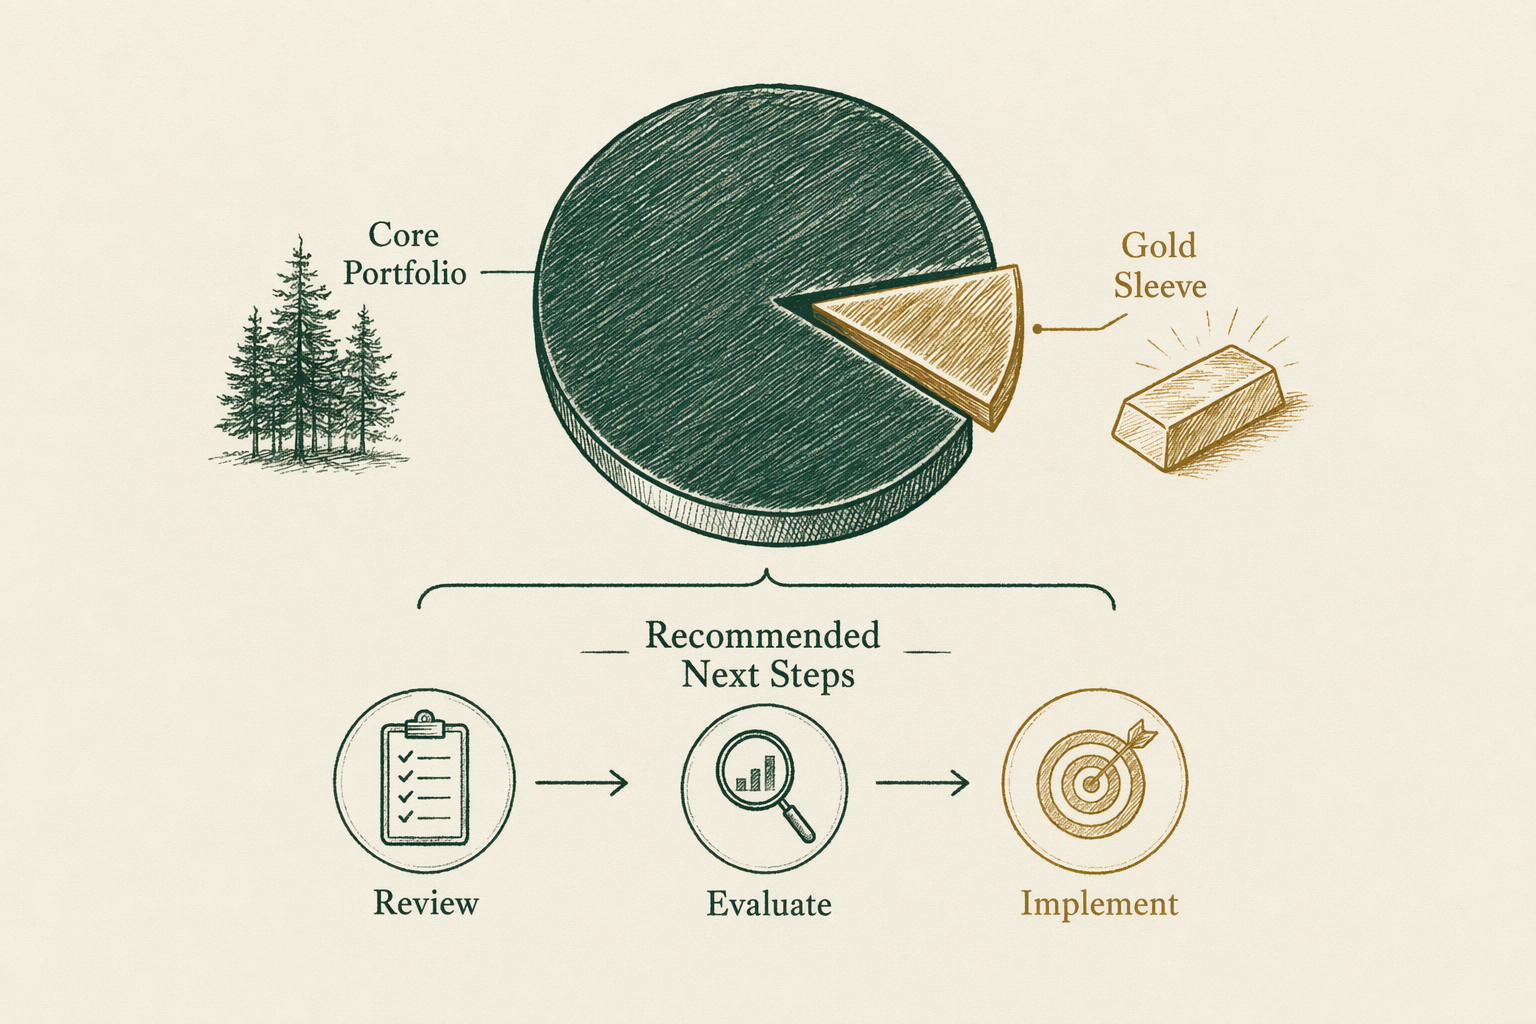
Recommended next steps
Three pointers. For the historical case study on `2008` specifically, see `/case-studies/2008-financial-crisis-gold-price-action/` — dated price action with primary-source citations. For the broader market-state research on gold (spot, futures, central-bank flows, ETF holdings) see `/research/market-state/`. For the specific question of how much gold a portfolio should hold, see `/learn/how-much-gold-should-a-portfolio-hold/` — the editorial framing without a personalized recommendation.
For the buying-mechanics side, see `/guides/buying-physical-gold/` for the physical-bullion route, `/reviews/gold-ira-companies/` for the IRA wrapper, and `/reviews/bullion-dealers/` for the dealer comparison. The vehicle choice (physical bullion at home, allocated storage in a private vault, Gold IRA, or gold ETF) is a separate question from the allocation-percentage question and depends on tax treatment, liquidity needs, and personal preference.
For the personalized allocation question, consult a licensed adviser. The desk does not deliver a personalized allocation percentage because the right number depends on time horizon, tax position, liquidity needs, and overall portfolio composition — factors the desk does not know about you. The licensed adviser does.
Want to talk this through? Book a 30-min research call →
Frequently asked questions
-
Does gold actually 'insure' a portfolio?
Partially. Historical analysis shows a modest gold allocation has reduced peak-to-trough drawdowns during certain equity bear markets. The effect is sample-dependent — 2008 was kinder to gold than 1980-2000. Treat gold as one of several diversifiers, not a guaranteed hedge. -
What allocation is 'insurance' vs 'directional bet'?
Common practitioner framing places 5-15% as a diversification sleeve and above 15% as an increasing directional bet. There is no academic consensus on the boundary. -
Where do I go next?
Start with the linked topic hub for a deeper foundation, then the comparison page that matches your selection criteria. Every claim about a company carries a snapshot date — confirm current arrangements before committing. -
Is this personalized advice?
No. BullionLens publishes editorial coverage, not personalized investment advice. Use this material to understand the landscape, then consult a licensed adviser for your specific situation.
In plain English We're an editorial desk. Educational only — talk to a licensed adviser before doing anything with retirement assets.