The central bank gold buying shift, 2018-2024
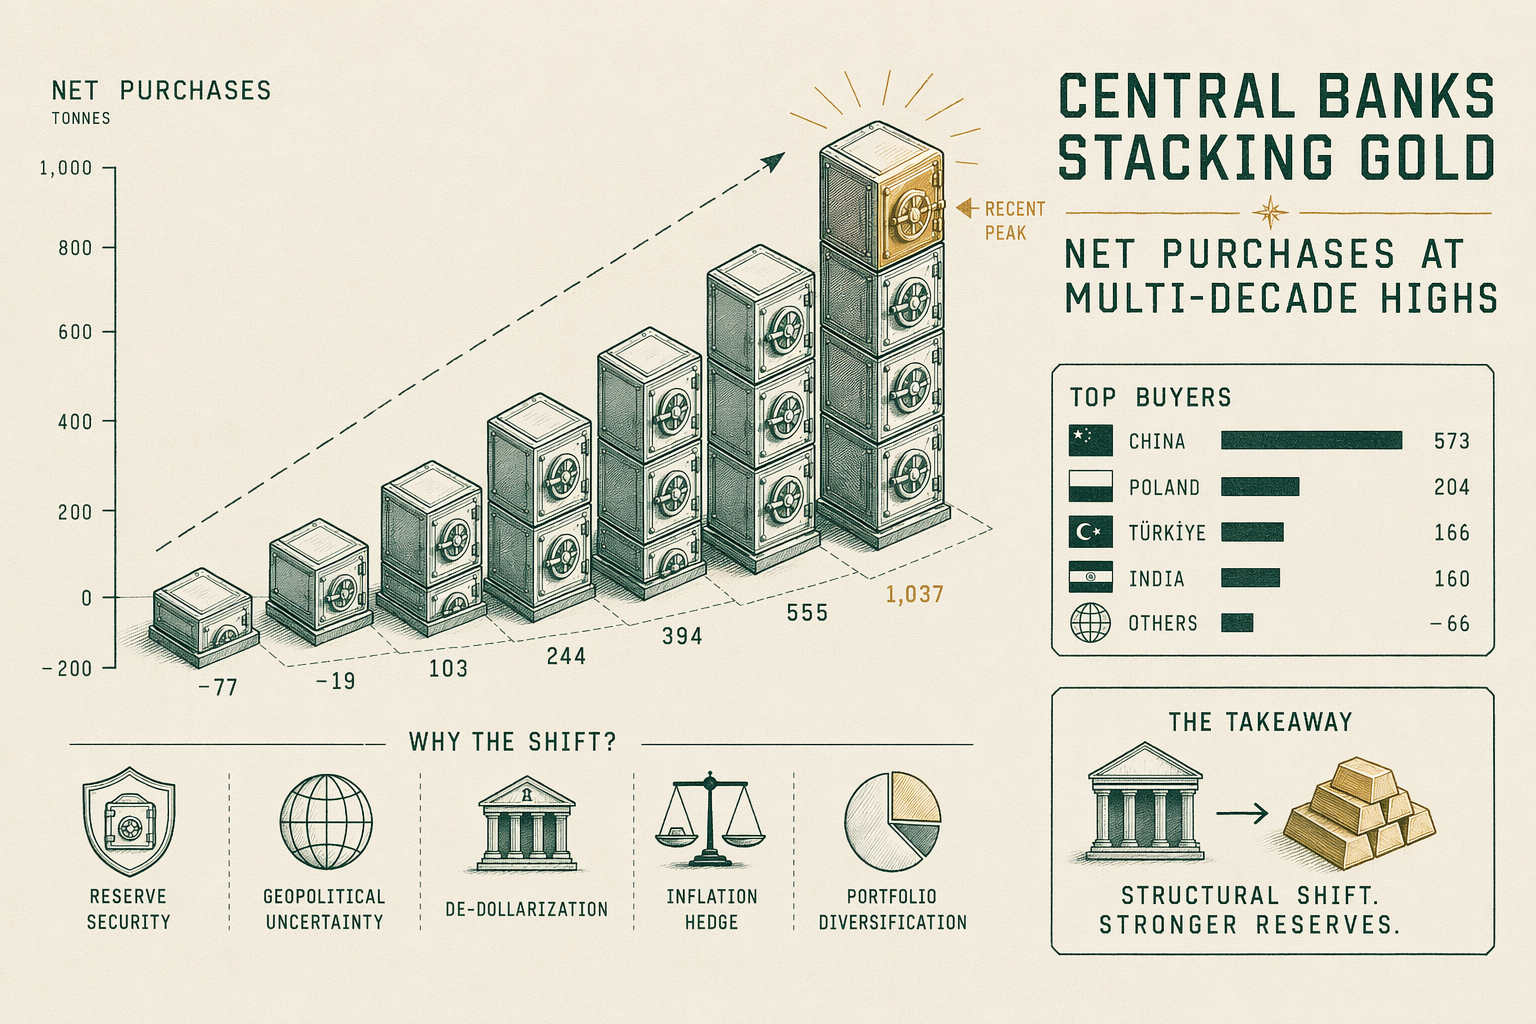
How central-bank net gold purchases hit multi-decade highs from 2018 onward, the largest buyers, and the structural drivers behind the shift.
Pre-2018 baseline — modest net buying
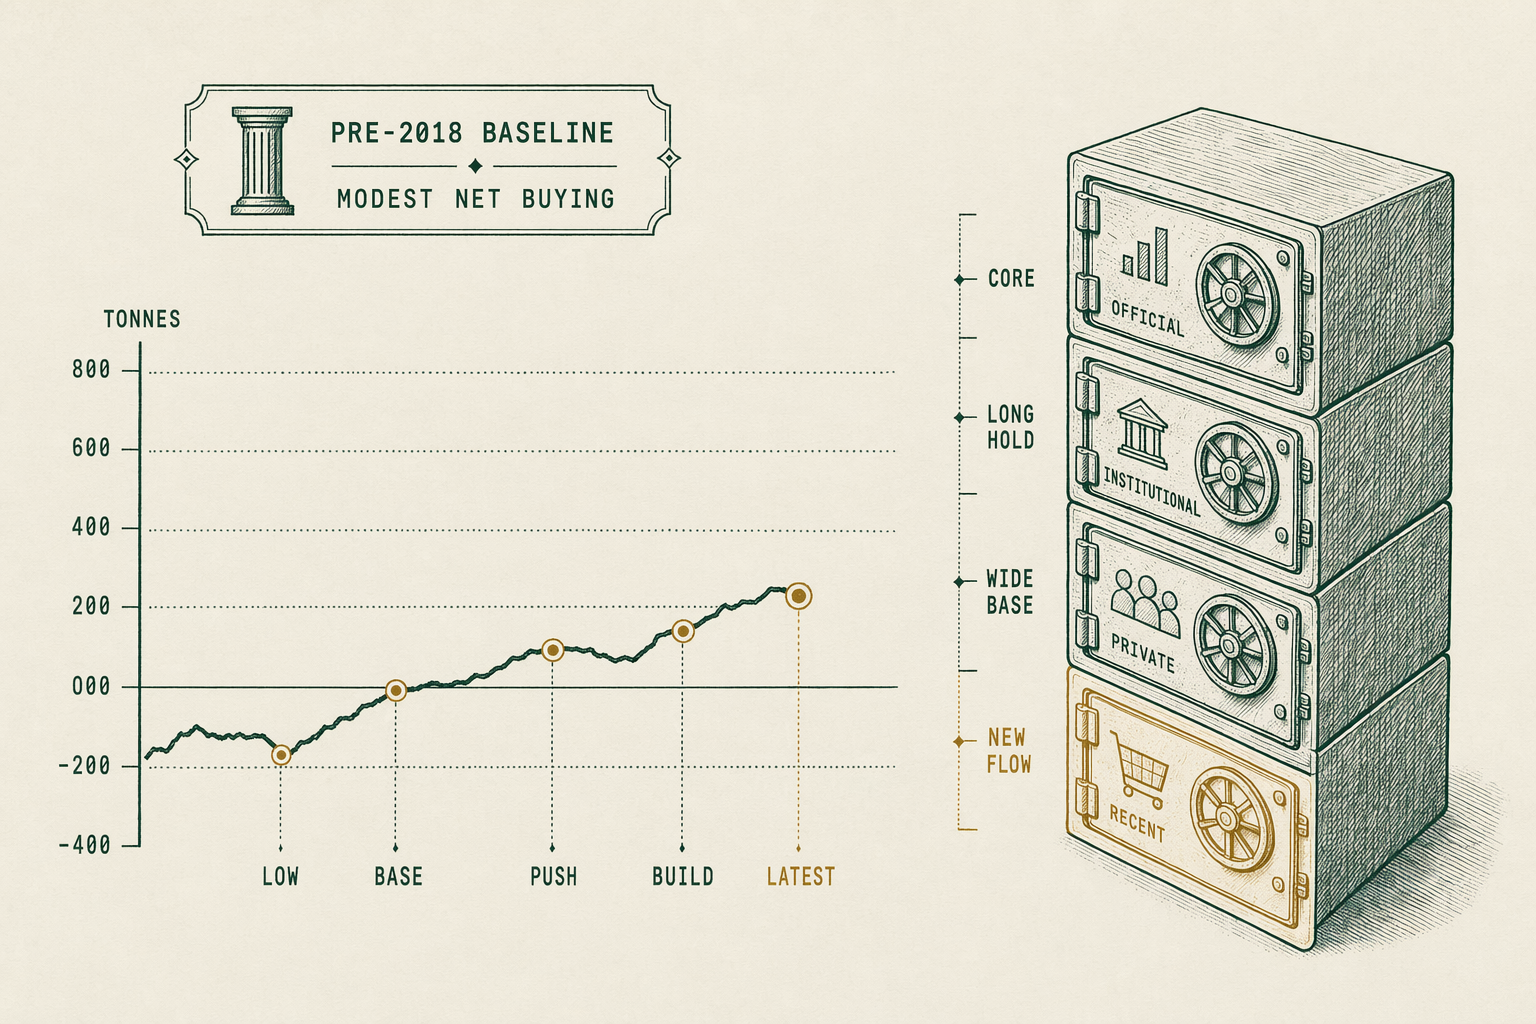
The 2010-2017 baseline for central-bank gold flows was modest net buying, dominated by a small number of emerging-market central banks plus the IMF-sale absorption pattern. Annual net purchases ranged from approximately `400` tonnes (2014) to approximately `656` tonnes (2010 — driven heavily by the IMF's `400`-tonne sale program absorbed by India, Sri Lanka, and Mauritius).
Pre-2010, the central-bank story was Washington-Agreement-era net selling by European central banks, with the resulting downward pressure on prices a contributing structural factor to the early-2000s gold-market low. The 1999 Washington Agreement (covered in /guides/central-bank-flows/) capped collective European sales at `400` tonnes per year through 2004, with subsequent renewals through 2014. The agreement effectively ended European-coordinated selling by the late 2010s.
By 2017, the central-bank flow had been modestly positive for a decade but was not yet a structurally significant variable in market analysis. World Gold Council's 2017 demand-trends report listed central-bank net buying at approximately `375` tonnes — a meaningful but not market-moving number against total annual mine supply of roughly `3,200` tonnes plus recycled supply of roughly `1,150` tonnes.
The 2018 inflection point was visible in retrospect but was not flagged as a regime change in real-time institutional commentary. It became unmistakable as a regime change only with the 2022-2023 acceleration.
2018-2019 — the inflection
2018 net central-bank buying reached approximately `656` tonnes — the highest reading since 1971. The acceleration was visible in the second half of 2018, with Russia, Turkey, and Kazakhstan among the largest reported buyers in the year.
2018 was also the year the World Gold Council began publishing its annual Central Bank Gold Reserves Survey, providing a structured institutional view of reserve-manager intent. The first survey (released in 2018, polling 2017-2018 reserve-management practice) established the baseline against which subsequent years would be measured.
2019 net buying came in at approximately `605` tonnes — slightly below 2018 but still well above the pre-2018 baseline. China resumed reporting gold purchases in late 2019 after a several-year reporting gap, adding approximately `100` tonnes through the year by official reporting (with research-firm estimates suggesting actual purchases may have been higher).
The 2018-2019 inflection had two visible drivers in the institutional commentary. First, the Trump administration's trade-policy posture and the resulting depreciation pressure on emerging-market currencies prompted reserve-management diversification away from US dollar holdings. Second, the post-2014 normalization of European central-bank gold policy (away from active selling) reduced the marginal supply pressure on the market, allowing the demand-side accumulation to flow through to net flows more cleanly.
2020-2021 — pandemic-era patterns
2020 net central-bank buying came in at approximately `255` tonnes — materially below the 2018-2019 pace. The COVID-19 pandemic's onset and the resulting economic disruption shifted reserve-management priorities; some central banks paused gold accumulation to maintain reserve-deployment flexibility. Russia, notably, halted its multi-year gold-accumulation program in mid-2020 (though for reasons specific to Russian monetary policy rather than the broader pandemic).
2021 net buying recovered to approximately `463` tonnes as the immediate-pandemic-stress phase passed and reserve-management normalization resumed. The buying was concentrated in a smaller number of emerging-market central banks (Thailand, India, Hungary among the more notable), reflecting an accumulation pattern that had quietly continued among committed buyers despite the broader 2020 pause.
Through 2020-2021, China continued reporting modest official gold accumulation. The Reserve Bank of India maintained its multi-year accumulation pattern. The National Bank of Poland began the buying program that would accelerate in subsequent years.
Cumulative 2018-2021 net central-bank buying: approximately `1,979` tonnes over four years — an annualized average of `495` tonnes/year. This was already a structurally meaningful flow against total annual primary supply, but the dominant institutional narrative still treated central-bank flows as a supportive-but-not-driving factor in gold-market analysis.
2022-2023 — multi-decade highs
2022 net central-bank buying came in at approximately `1,082` tonnes — the highest annual figure on record (the World Gold Council's tracking series goes back to 1971). The figure represented roughly `25%` of total annual mine supply for the year.
The 2022 acceleration was concentrated in the second half, with the largest single-quarter reading (`Q4 2022`) coming in at over `400` tonnes by WGC's tracking. The acceleration coincided with the post-February-2022 Western-government freezing of Russian central-bank reserves and the broader sanctions framework that followed.
Buyers identified in 2022 published reporting included the Central Bank of Turkey (over `100` tonnes), the National Bank of Poland (`28` tonnes added during 2022 with a much larger announced program), the Central Bank of Uzbekistan (`34` tonnes), the Reserve Bank of India (`33` tonnes), the Qatar Central Bank (`33` tonnes), and several smaller buyers. A significant unattributed portion of 2022 buying was reflected in the WGC totals but did not match published country-level data — the discrepancy is widely understood in the institutional analyst community to represent additional buying by central banks that did not publish corresponding holdings increases. China is the most cited candidate for the unattributed portion.
2023 net buying came in at approximately `1,037` tonnes — the second-highest reading on record, just behind 2022. China officially resumed reporting gold purchases in late 2022 and added approximately `225` tonnes through 2023 by published reporting. The National Bank of Poland accelerated to over `100` tonnes in 2023. Turkey continued buying but at a more variable pace as Turkish monetary-policy dynamics shifted across the year.
Cumulative 2022-2023 net buying: approximately `2,119` tonnes over two years — over four times the 2018-2021 annualized pace. The shift from 'a structural factor' to 'a load-bearing structural factor' had occurred.
The largest buyers by country
Across the 2018-2024 window, the cumulative top reported buyers ranked by net additions (per published holdings data and WGC tracking):
1. China (People's Bank of China) — approximately `725` tonnes officially reported, with research-firm estimates suggesting actual accumulation may be `1,500` to `2,500` tonnes given persistent reporting-vs-actual discrepancies.
2. Russian Federation (Bank of Russia) — approximately `420` tonnes through mid-2020 (when the program was paused). Post-2022 Russian central-bank gold holdings are not externally verifiable in the way pre-2020 holdings were.
3. Turkey (Central Bank of the Republic of Türkiye) — approximately `407` tonnes net, though with significant intra-period volatility. Turkey's buying pace fluctuated with broader monetary-policy dynamics.
4. India (Reserve Bank of India) — approximately `260` tonnes net, building on the post-2009 IMF-sale absorption baseline.
5. Poland (National Bank of Poland) — approximately `258` tonnes net, with the bulk of the accumulation occurring in 2019 and 2022-2024.
6. Kazakhstan (National Bank of Kazakhstan) — approximately `100` tonnes net, with significant intra-year selling and buying activity reflecting tactical reserve-management.
7. Singapore (Monetary Authority of Singapore) — approximately `78` tonnes net, with most of the accumulation occurring in early 2023.
Smaller-but-directionally-consistent buyers in the same window: Hungary, Thailand, Czech Republic, Iraq, Uzbekistan, Qatar, Mongolia, and a number of others. The aggregate emerging-market pattern is the more important variable than any individual country's behavior.
Notable non-buyers in the same window: the western developed-market central banks. Federal Reserve System, European Central Bank (which holds the Eurosystem reserve gold on behalf of euro-area members), Bank of Japan, Bank of England — all broadly net-stable or marginally selling. The Swiss National Bank has been net-stable. Australia's Reserve Bank has been net-stable. Canada continues to hold essentially no gold reserves, having sold its position in earlier decades.
What the World Gold Council survey says
The World Gold Council's annual Central Bank Gold Reserves Survey provides the institutional reserve-manager-stated-rationale data alongside the actual flow data. The 2024 survey (polling 2023-2024 reserve-management practice) reported the following stated rationales for holding gold (multiple-response question):
• 'Performance during times of crisis': cited by `76%` of responding central banks. Top-ranked rationale. • 'Long-term store of value': `73%`. • 'Effective portfolio diversifier': `72%`. • 'No default risk': `64%`. • 'No counterparty risk': `62%`. • 'Performance during times of high inflation': `57%`. • 'Geopolitical risk': `40%` (elevated from `20%` in pre-2022 surveys). • 'Sanctions resilience': not separately tracked pre-2022; cited prominently in 2023-2024 survey commentary as a cross-cutting theme.
The 2024 survey found `81%` of responding central banks expected global central-bank gold holdings to increase over the next `12` months — the highest reading in the survey's history. `29%` indicated their own institution planned to increase its gold holdings — also the highest reading.
Survey methodology caveat: the responses reflect stated rationale from responding institutions. Whether central banks actually buy because of the stated reasons, or whether they buy for other reasons and report the survey-friendly language, is not externally resolvable. The survey data and the actual flow data together provide the institutional picture; neither alone is sufficient.
The 'sanctions resilience' theme — emergent since 2022 and prominent in 2023-2024 — is the closest the survey data comes to identifying a specific event-driven explanation for the post-2018 acceleration. The 2022 freezing of Russian central-bank reserves was a material institutional event, and survey responses post-2022 reflect that institutional memory.
Where to learn more
Primary institutional sources: the World Gold Council's annual Central Bank Gold Reserves Survey (2018-2024 editions); the WGC quarterly Gold Demand Trends reports (each contains a central-bank flows section); the IMF International Financial Statistics for the underlying holdings data; the central banks' own published reserve communications (especially the Bundesbank's annual reports, the National Bank of Poland's Governor Glapinski's public statements, the Bank of Russia's pre-2022 monthly gold-reserves bulletins).
Academic and analytical treatments: the Bank for International Settlements' working papers on central-bank reserve composition; Sandeep Mahajan's work on central-bank reserve management; the Council on Foreign Relations' geoeconomics analysis on reserve-asset deployment.
Commercial-research analyses (worth reading with awareness of the firms' own positions): Société Générale's commodity-research desk on China's actual gold-buying versus reported; HSBC Bank's institutional gold-research desk; the Royal Bank of Canada's commodity-strategy notes on central-bank flows; and the Metals Focus annual Gold Focus report which has covered the central-bank flow shift in detail.
In plain English
In plain English: between 2018 and 2024 central banks worldwide went from being a minor source of gold demand to being a major one. 2022 and 2023 both set multi-decade records for net buying — over 1,000 tonnes per year, equivalent to roughly a quarter of all newly-mined gold. Almost all of it came from emerging-market central banks (China, Poland, Turkey, India, Singapore). The 2022 Western freezing of Russian central-bank reserves materially boosted the 'we need to hold reserves we can actually use' theme in reserve-manager surveys. The 2024 WGC survey reports the highest-ever percentage of central banks expecting global gold holdings to keep rising. We don't predict where this goes — but it's now a structural feature of gold-market analysis, not a footnote.
Frequently asked questions
-
Why did central banks ramp up gold buying after 2018?
Per WGC's annual reserve survey, top stated reasons include diversification, geopolitical risk hedging, and (especially after 2022) sanctions resilience. The 2022 freezing of Russian central bank dollar reserves materially elevated 'sanctions resilience' in subsequent survey responses. -
Which countries bought most?
Per published data, the People's Bank of China, the National Bank of Poland, the Central Bank of Turkey, the Reserve Bank of India, and the Monetary Authority of Singapore have been among the largest reported net buyers in this window. -
Is BullionLens an investment adviser based on these case studies?
No. Case studies are historical event analyses, not recommendations. We are an editorial research desk. Consult a licensed adviser before applying any historical pattern to your own situation. -
How are the case studies sourced?
Primary financial-market data (LBMA fixings, COMEX volume, World Gold Council reports), SEC filings of involved entities, court records where applicable, and contemporary news coverage. Every claim of fact carries a citation in the body.
In plain English A historical event, not a forecast. Numbers are sourced from LBMA + WGC + primary regulatory filings.