Gold for inflation hedging
Editorial guide on gold as an inflation hedge: the 1970s correlation, the 1980s-2000s decoupling, and what the academic literature actually says.
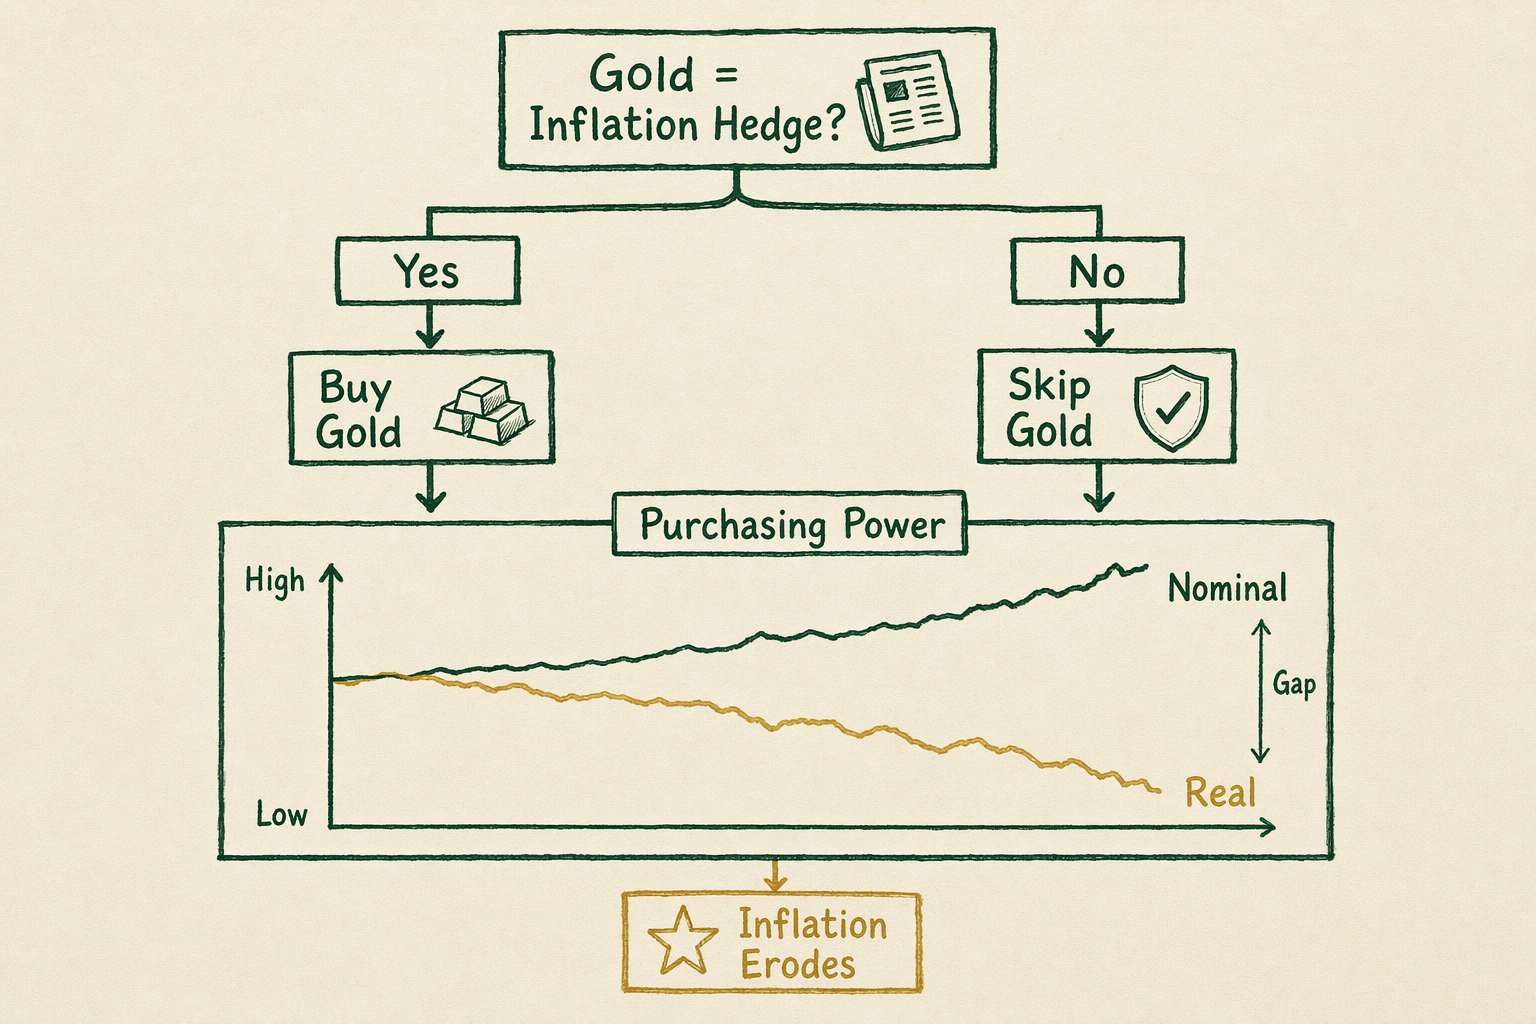
If you bought the 'gold = inflation hedge' headline
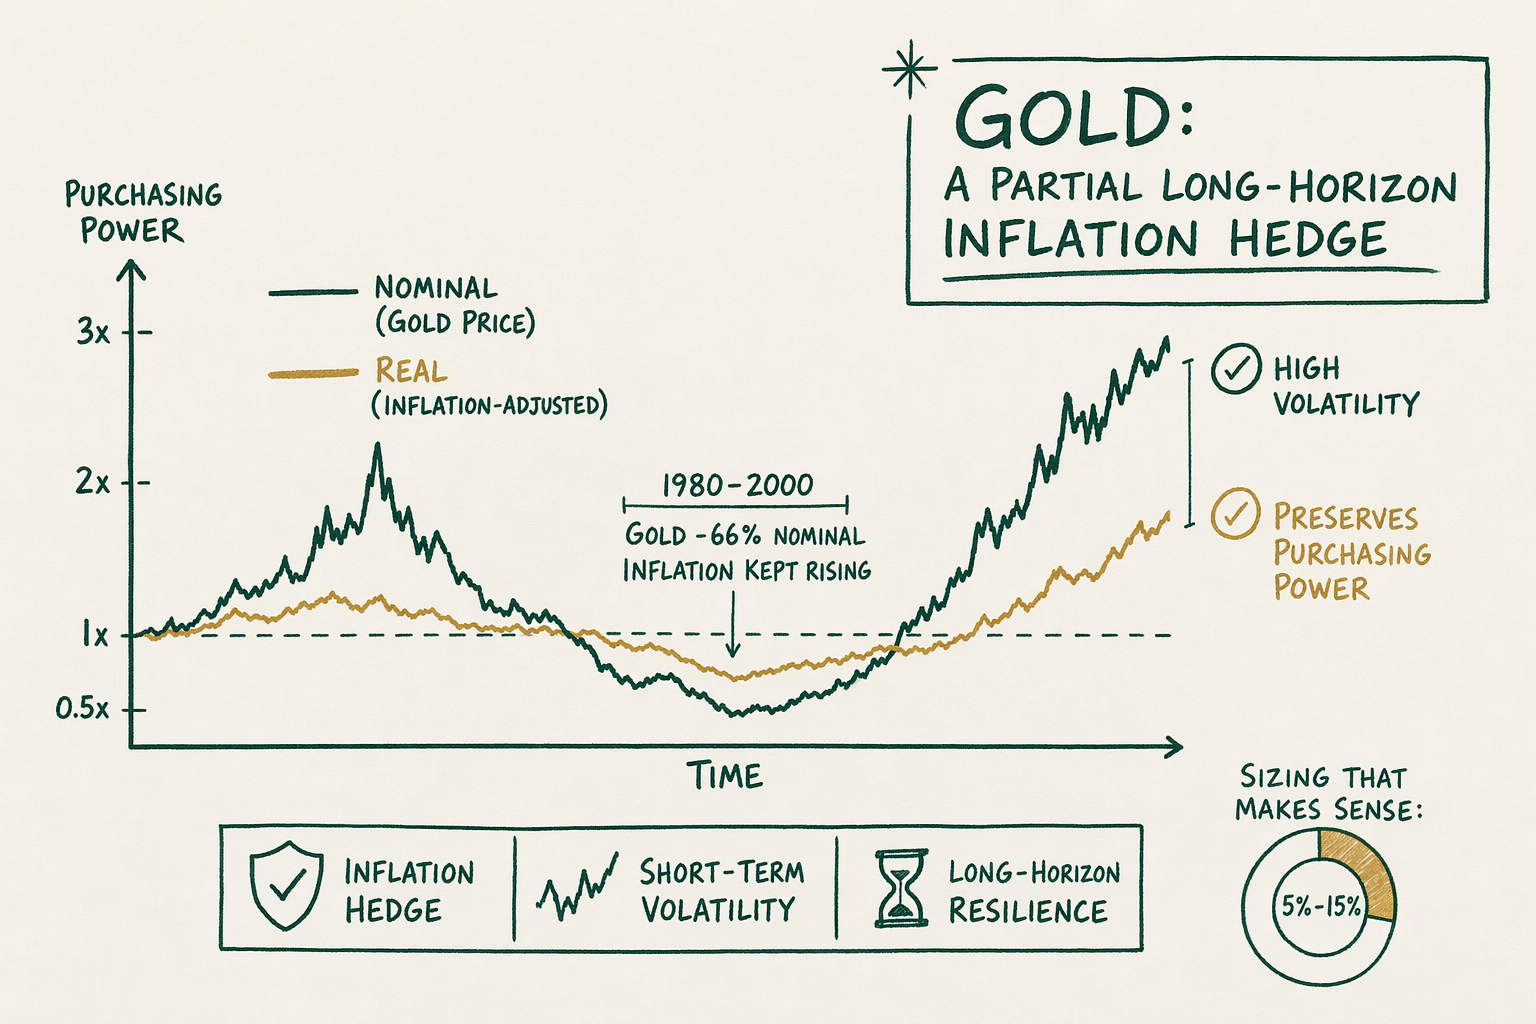
If you have read financial commentary in the last few years you have probably encountered some version of the claim that gold is an inflation hedge. The claim is partially true, partially misleading, and the academic literature is more careful about it than the marketing copy is. Over very long horizons (multi-decade) gold has broadly preserved purchasing power against US dollar inflation; over short horizons (months to a few years) gold's relationship with the consumer price index is weak and regime-dependent, and there have been long stretches when gold underperformed inflation materially.
This guide walks the historical record. The `1970s` is the canonical 'gold rose with inflation' decade, with caveats about why. The `1980-2000` window is the canonical 'gold underperformed inflation' counter-example. The `2000s` and `2020s` are mixed cases with their own structural drivers. The summary is that gold is plausibly a long-horizon inflation hedge with significant short-horizon volatility, which means an inflation-hedge framing requires honest acknowledgment of the time-horizon involved. The desk's editorial position is to describe the evidence and let the audience draw their own conclusions in consultation with a licensed adviser.
What this guide covers
Five sections. First, the `1970s` case — the decade most often cited in support of the inflation-hedge framing, with the structural details that make the case more complicated than the headline suggests. Second, the `1980-2000` decoupling, the canonical counter-example that the audience encountering this material should be aware of. Third, the `2000s` and `2020s` mixed signals — neither decade fits the simple 'gold tracks inflation' framing. Fourth, the academic literature on short-horizon vs long-horizon evidence. Fifth, practical sizing implications for an inflation-hedge-framed gold allocation.
Each section ends with the licensed-professional pointer for personalized questions. The desk does not deliver forward-looking calls or a personalized allocation percentage; both questions belong with a licensed adviser who knows your specific tax position, time horizon, and overall portfolio composition.
Note on data sources: price data is from the LBMA daily gold price (or the London afternoon fixing where the LBMA daily price did not yet exist as a benchmark). Inflation data is from the US Bureau of Labor Statistics Consumer Price Index for All Urban Consumers (CPI-U), seasonally adjusted, with the snapshot dates noted inline.
The 1970s case
From January `1970` to December `1979`, the US CPI-U rose by approximately `103%`, an annualized rate of roughly `7.4%`. Over the same decade gold rose from roughly `$35/oz` (the pre-`1971` Bretton Woods peg, which was lifted in August `1971`) to roughly `$512/oz` at year-end `1979`, a `+1,360%` nominal move and approximately `+13` times the cumulative inflation rate. The decade is the canonical 'gold as inflation hedge' decade in popular financial commentary.
The caveats matter. The decade opened with the unwinding of the Bretton Woods gold-dollar peg in `1971`, a structural shift that released gold from an explicit currency-redemption mechanism that had artificially suppressed the price. A meaningful portion of the `1970s` gold move was the catch-up from the peg's removal, not a pure inflation-tracking response. The `1973-1974` and `1979-1980` peaks were also driven by acute macroeconomic stress events — the oil shocks and the Iran-related geopolitical disruption — that are not pure inflation events. The decade-end peak in early `1980` (briefly above `$800/oz`) preceded a sharp correction; gold lost more than `60%` of its peak value over the following twenty months as policy tightening under Volcker brought inflation expectations under control.
What the `1970s` decade clearly shows is that gold can rise dramatically in a high-inflation regime with concurrent monetary and geopolitical stress. What it does not clearly show is that gold tracks inflation in a reliable mechanical fashion; the move was much larger than inflation alone would explain, and the timing of the peak was driven by factors beyond CPI.
1980-2000 decoupling
From January `1980` to December `1999`, the US CPI-U rose by approximately `121%`, an annualized rate of roughly `4.0%`. Over the same window gold moved from its early-`1980` peak near `$850/oz` to year-end `1999` near `$290/oz`, a nominal decline of `-66%` and a real-terms decline of substantially more once cumulative inflation is netted out. A `$1,000` gold position made at the early-`1980` peak retained less than `$300` of nominal value by the end of `1999`, while the real purchasing power of that nominal value had further declined by another `~55%` from the inflation cumulation.
This window is the canonical counter-example to the 'gold tracks inflation' framing. Gold did the opposite of tracking inflation for a roughly twenty-year stretch. The structural reasons are documented in the financial-history literature: the Volcker tightening cycle in the early `1980s` raised real interest rates dramatically and pulled investor capital out of gold and into bonds; the disinflationary trend that followed reduced the inflation-hedge premium that had built into the price; and the technology-driven equity bull market of the `1990s` offered competitive returns that drew capital further away from a metal sitting in vaults.
The window matters editorially because any honest framing of 'gold as inflation hedge' needs to acknowledge it. A hypothetical buyer who purchased gold in early `1980` specifically as an inflation hedge against the `1970s` inflation regime found themselves holding an underperforming asset for the next twenty years. The window does not disprove the inflation-hedge framing over very long horizons; it does demonstrate that short-to-medium-horizon timing matters dramatically.
2000s and 2020s mixed signals
From January `2001` to December `2011`, gold moved from roughly `$265/oz` to a peak near `$1,895/oz`, a `+615%` nominal move. Over the same window the US CPI-U rose by approximately `30%`, an annualized rate of roughly `2.4%`. Gold dramatically outpaced inflation. The drivers were varied: the post-`2001` recession monetary response, the `2007-2009` financial-crisis policy interventions, the European sovereign-debt scare, central-bank buying after the Washington Agreement wound down, and a structural shift in retail investor sentiment toward commodities. The CPI-tracking framing captures only a small piece of this move.
From `2011` to `2019` gold moved roughly sideways, then declined modestly in nominal terms while US CPI continued rising. The `2011-2015` window saw gold lose roughly `45%` of its peak nominal value while CPI rose another `~7%` cumulatively. Another stretch of inflation-hedge underperformance, with structural drivers (the unwind of the post-crisis premium, the rise of cryptocurrencies as an alternative store-of-value narrative for some investors, the strong US dollar) that the CPI-tracking framing again does not capture.
The `2020-2024` window is the most recent and the most relevant to current readers. US CPI rose by approximately `21%` cumulatively from January `2020` to December `2024`, an annualized rate of roughly `3.9%`. Gold moved from roughly `$1,520/oz` to roughly `$2,650/oz` over the same window, a `+74%` nominal move. Gold outpaced CPI substantially over the recent five-year window, consistent with the broader 'gold as a long-horizon inflation hedge' framing but with all the regime-specific drivers (post-COVID monetary response, geopolitical events, central-bank buying acceleration) that any honest analysis has to include.
Short-horizon vs long-horizon evidence
The academic literature on gold as an inflation hedge is more careful than the popular commentary. Erb and Harvey's `2013` paper 'The Golden Dilemma' (in the Financial Analysts Journal) walks the evidence carefully and concludes that gold is a long-horizon inflation hedge with significant short-horizon volatility — the multi-decade real return on gold has been roughly flat in real terms, supporting the 'preserves purchasing power' framing, while short-horizon (1-5 year) correlations with CPI are weak and unreliable.
Other empirical work (Beckmann and Czudaj `2013`, World Gold Council ongoing research) reaches broadly similar conclusions: the inflation-hedge property emerges over multi-decade horizons with substantial regime-dependent variation in the shorter run. A reader holding gold as an inflation hedge with a `30`-year holding horizon has historical-evidence support for the framing. A reader holding gold as an inflation hedge over a `3`-year horizon is making a different bet that the historical record supports much less reliably.
What no academic literature supports is the framing that gold tracks CPI in a tight mechanical fashion in any short window. The relationship is loose, regime-dependent, and historically subject to long stretches of underperformance. Any framing tighter than 'partial long-horizon hedge with significant short-horizon volatility' overstates the case.
Practical sizing for an inflation-hedge sleeve
The sizing math for an inflation-hedge sleeve overlaps substantially with the sizing math for a more general portfolio-insurance sleeve (covered in detail at `/for-portfolio-insurance/`). The practitioner-typical range of `5%`-`15%` of a portfolio captures the framing where the allocation is large enough to matter in adverse regimes but small enough not to dominate expected-scenario returns. Above `15%` the position starts to become a directional bet on inflation specifically.
Time horizon matters more for inflation-hedge framing than for general drawdown-hedge framing. The historical evidence supports the inflation-hedge claim over multi-decade horizons and is much weaker over short horizons. A reader allocating to gold as an inflation hedge with a `5`-`10` year horizon should be aware that the historical record includes long stretches when gold underperformed inflation; the framing is consistent with the long-run evidence but the short-run path is not guaranteed.
The vehicle choice (physical bullion, Gold IRA, gold ETF) is a separate question from the allocation-percentage and time-horizon questions. The tax treatment differs by vehicle, the liquidity differs, and the storage logistics differ. See `/guides/buying-physical-gold/` for the physical-bullion route, `/reviews/gold-ira-companies/` for the IRA wrapper, and `/research/market-state/` for the broader market context.
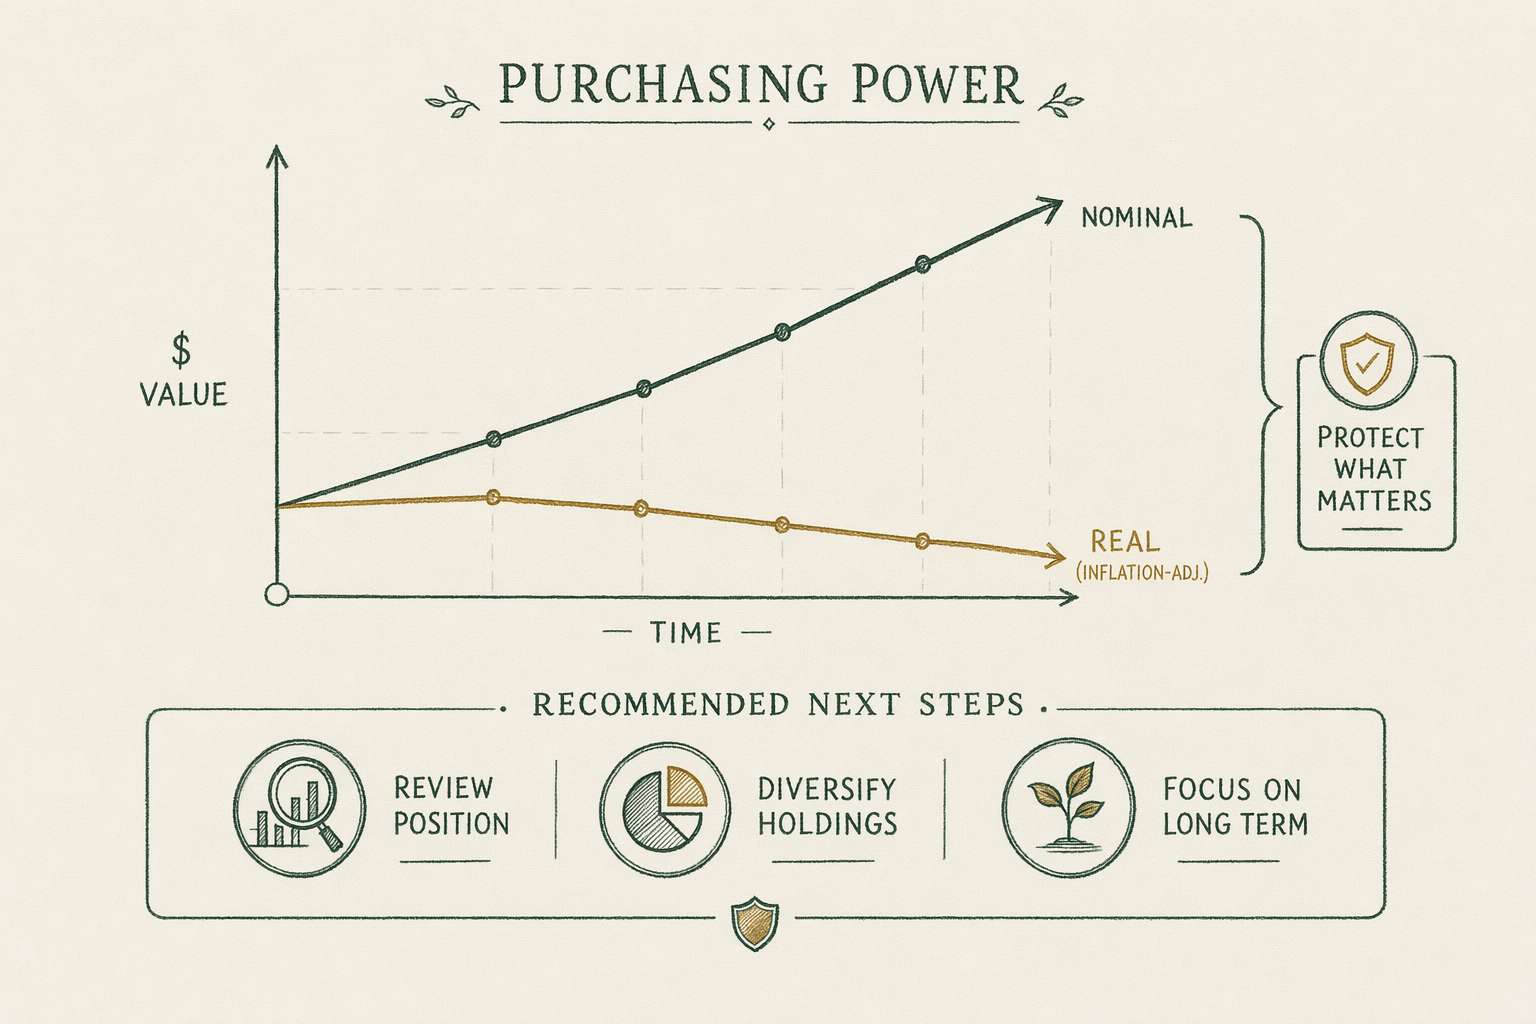
Recommended next steps
Three pointers. For the academic and World Gold Council research on gold as a strategic asset, the citations at the foot of this page link to the foundational papers. For the broader portfolio-insurance framing (which overlaps substantially with the inflation-hedge framing on the practical sizing side), see `/for-portfolio-insurance/`. For the broader market-state research on gold (spot price formation, central-bank flows, ETF holdings), see `/research/market-state/`.
For the vehicle decision (physical bullion, Gold IRA, ETF), see `/guides/buying-physical-gold/`, `/reviews/gold-ira-companies/`, and the editorial coverage at `/reviews/bullion-dealers/`. The vehicle choice depends on tax position, liquidity needs, and personal preference for direct possession — separate from the allocation-percentage question.
For the personalized allocation question — how much, in which vehicle, with what time horizon — consult a licensed adviser. The desk does not deliver a personalized recommendation because the right answer depends on factors the desk does not know about you. The licensed adviser does, and the desk's role is to provide the editorial framing that lets you ask better questions when you sit down with them.
Want to talk this through? Book a 30-min research call →
Frequently asked questions
-
Is gold a reliable inflation hedge?
Reliable over long horizons (multi-decade), unreliable over short horizons (months to a few years). The academic literature generally supports gold as a long-run store of value, not as a short-run CPI tracker. -
Where do I go next?
Start with the linked topic hub for a deeper foundation, then the comparison page that matches your selection criteria. Every claim about a company carries a snapshot date — confirm current arrangements before committing. -
Is this personalized advice?
No. BullionLens publishes editorial coverage, not personalized investment advice. Use this material to understand the landscape, then consult a licensed adviser for your specific situation. -
Where can I learn more?
See the linked topic hub for the foundational explainer, the related T3 articles for deeper coverage, and /editorial-standards/ for our methodology.
In plain English We're an editorial desk. Educational only — talk to a licensed adviser before doing anything with retirement assets.