The gold-silver ratio — historical range and what it means
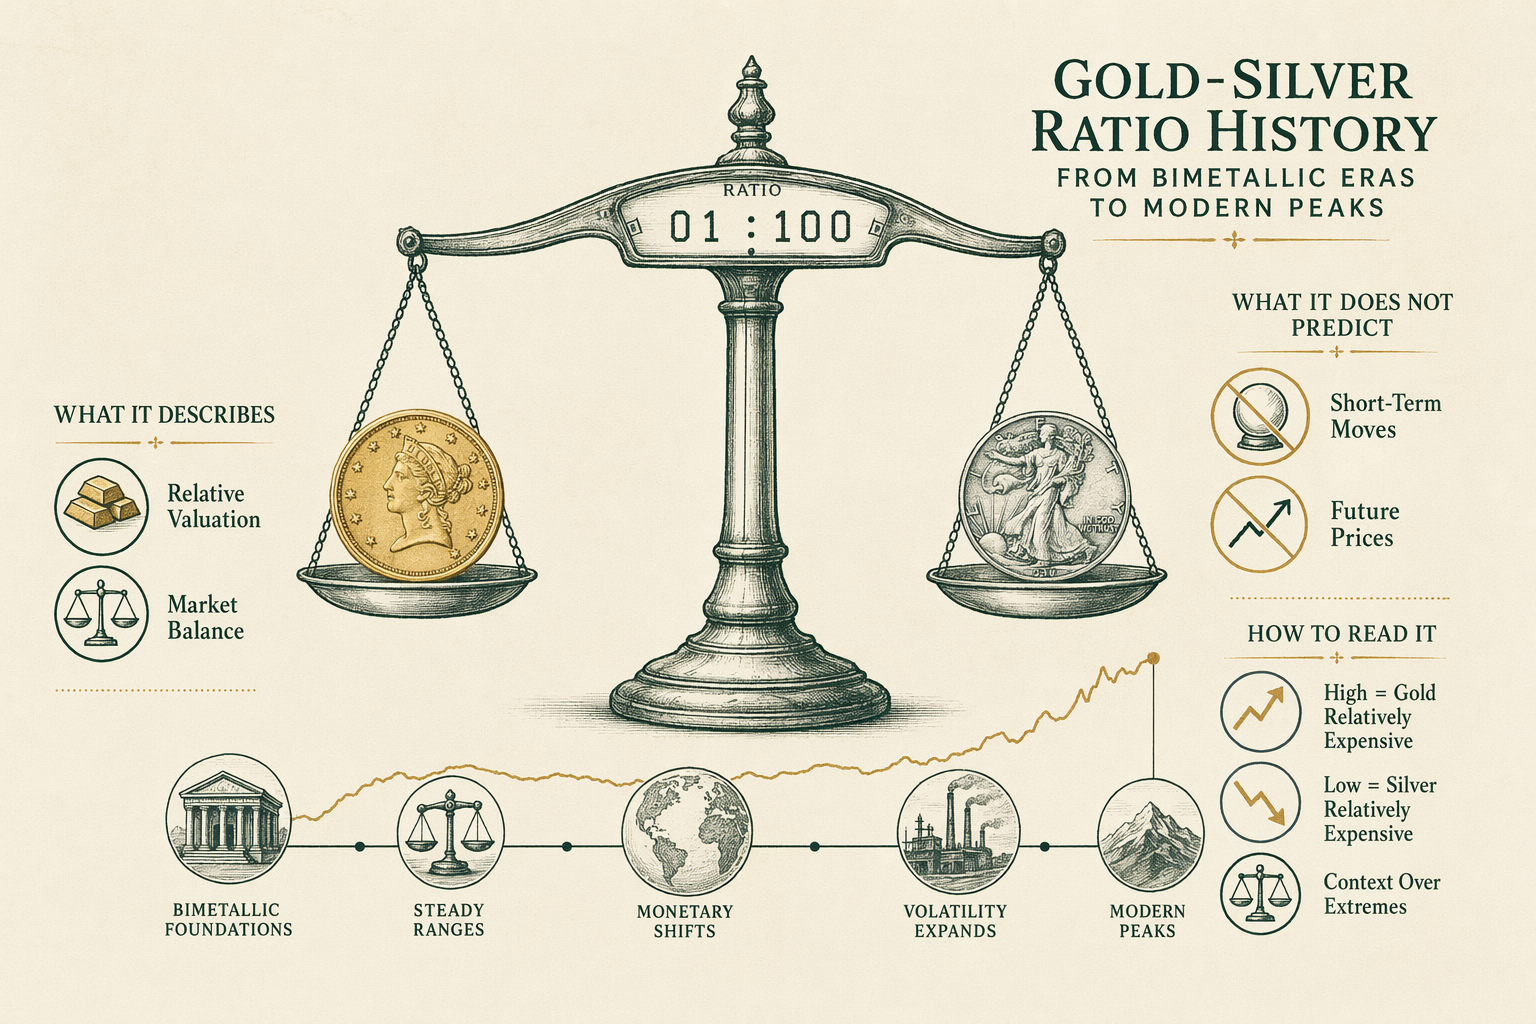
Gold-silver ratio history from bimetallic eras to modern peaks. What the ratio describes, what it does not predict, and how to read it.
The simple math
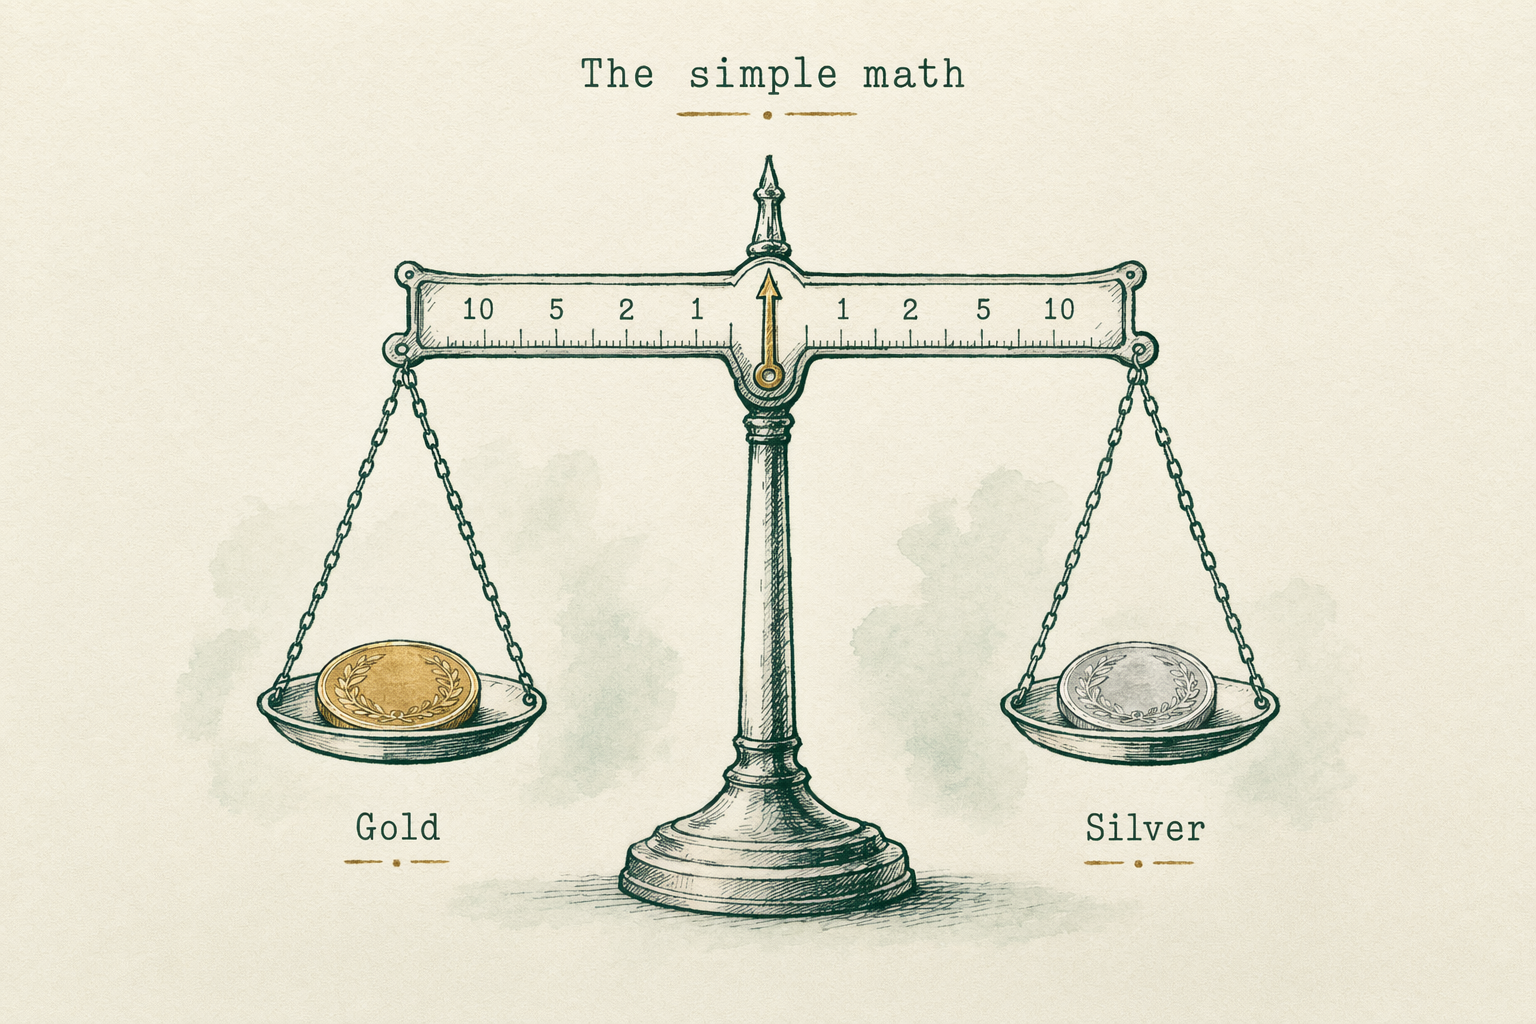
The gold-silver ratio at any instant is the spot price of one troy ounce of gold divided by the spot price of one troy ounce of silver, both quoted in the same currency (typically US dollars). The result is a unit-less number expressing how many ounces of silver are required to acquire one ounce of gold.
Example arithmetic: with the LBMA Gold Price at `$2,400/oz` and the LBMA Silver Price at `$30/oz`, the gold-silver ratio is `$2,400 / $30 = 80`. Plain-English: at those prices, eighty ounces of silver buy one ounce of gold.
Both reference prices are themselves set by twice-daily auction in London — the LBMA Gold Price set at `10:30` and `15:00` London time, and the LBMA Silver Price set at `12:00` London time. The official daily ratio is calculated from these fixings. The intraday OTC market ratio is calculated continuously from the OTC-market spot streams, with the small dispersion between vendors discussed in the /guides/spot-vs-futures/ guide.
The ratio can be expressed several ways in common usage. `80:1` (eighty-to-one) is the colon notation, used informally. `80` (bare number) is the academic and data-table convention. `1.25%` (silver-as-percent-of-gold) is the inverse expression, less common but occasionally used. All three notations refer to the same underlying number.
Bimetallic-era benchmarks (15:1 to 16:1)
Before the late-19th-century shift to gold-standard monetary systems in the major industrial economies, most monetary regimes operated under bimetallic standards in which both gold and silver served as legal-tender money at a fixed mint ratio. The legal ratio anchored the market ratio, with arbitrage operating to enforce convergence.
The US Coinage Act of 1792 set the legal gold-silver ratio at `15:1`. The US Coinage Act of 1834 adjusted it to roughly `16:1` to better reflect prevailing world-market ratios. France maintained roughly `15.5:1` through most of the 19th century. The Latin Monetary Union (France, Belgium, Italy, Switzerland from 1865) standardized at `15.5:1`.
Before the printing-press era these ratios were anchored by the relative production cost and natural-occurrence-frequency of gold versus silver in known mineral deposits, modulated by the central-bank and treasury policy choices. The Spanish silver flow from Mexican and Bolivian mines in the 16th and 17th centuries pushed the ratio toward `10:1` to `13:1` for periods; the 19th-century gold discoveries in California (1849), Australia (1851), and South Africa (1886) tilted the ratio back toward `15:1` to `16:1` and ultimately above.
The bimetallic system collapsed in the 1870s as the major industrial economies (Germany 1871, US Coinage Act of 1873, France 1873-78, scandinavian countries) demonetized silver and shifted to gold-standard regimes. The legal gold-silver ratio anchor disappeared; the market ratio was free to drift. By the late 1890s the market ratio had widened to roughly `30:1`, well above the historical bimetallic anchors.
20th-century range
Through the 20th century the gold-silver ratio ranged broadly from the high-teens to the high-double-digits, with the multi-decade average sitting somewhere between `40:1` and `60:1` depending on which sub-period one selects.
Key inflection points: the 1929-1933 period of the Great Depression saw the ratio briefly above `80:1` as silver-mining stress and US Treasury policy depressed silver prices. The 1934 Silver Purchase Act in the US (which committed the Treasury to buy silver at supported prices) compressed the ratio meaningfully through the mid-1930s. The 1940s saw the ratio stabilize in the `30:1` to `50:1` range as wartime industrial demand for silver supported silver prices.
The 1979-1980 Hunt Brothers' attempted silver corner pushed silver from below `$6/oz` to above `$50/oz` over a `12`-month window, briefly compressing the gold-silver ratio below `20:1` in January 1980 — the lowest 20th-century reading. The COMEX rule changes and subsequent collapse of the corner sent silver back below `$10/oz` by year-end 1980, with the ratio rebounding to above `40:1`.
The 1990s and early 2000s saw the ratio range mostly between `50:1` and `80:1`, with a sustained period above `70:1` through the late 1990s reflecting depressed silver prices during a low-inflation, low-industrial-cycle period.
The 2008-2011 cycle saw silver materially outperform gold, with the ratio compressing from above `80:1` in 2008 to roughly `32:1` in April 2011 — the post-Hunt-era low. The subsequent silver underperformance pushed the ratio back to the `60:1` to `80:1` range through the mid-2010s.
The 2020 peak above 100:1
The most recent extreme reading on the gold-silver ratio occurred in March 2020, when the ratio briefly exceeded `120:1` during the COVID-19-pandemic-driven market stress.
The mechanics behind the 2020 peak were specific to silver's hybrid monetary/industrial demand profile. Silver derives roughly half of its demand from industrial uses (electronics, solar photovoltaics, automotive applications). When the March 2020 market dislocation triggered both a forced-liquidation cycle (similar to gold's 2008 behavior — see /case-studies/2008-financial-crisis-gold-price-action/) and a near-immediate collapse in industrial activity globally, silver was hit by both vectors at once.
Gold's behavior in the same window was more muted on the downside and faster on the rebound. The result was the ratio spike: gold held roughly steady (in the `$1,500/oz` range), silver collapsed (from above `$18/oz` to roughly `$12/oz` over a `2`-week window), pushing the ratio to readings above `100:1` for the first time in modern records.
Within `12` months the ratio had compressed dramatically as silver rebounded faster than gold during the recovery — by January 2021 the ratio was back in the `65:1` range. Within `24` months silver had pulled back and the ratio was again in the `75:1` to `85:1` range.
Lesson the 2020 peak teaches: extreme readings can occur quickly during cross-asset liquidity dislocations, and the structural drivers behind silver's industrial-demand half make it asymmetrically vulnerable to recession-onset events relative to gold. The peak was itself not predictive; the compression was rapid; the ratio returned to range-bound behavior within a year.
What the ratio does NOT tell you
The gold-silver ratio is sometimes presented as a trading signal — 'when the ratio is above `80:1`, silver is cheap and gold is expensive; sell gold and buy silver, then wait for mean reversion.' This narrative is intuitive and academically unsupported.
The empirical record: ratio readings above `80:1` have, on multiple historical occasions, been followed by further widening rather than compression. The 1990s saw sustained readings above `70:1` for years. The 2020 spike to `120:1` was followed by rapid compression — but the prior `15`-year run of readings between `60:1` and `90:1` was not followed by mean reversion to the bimetallic-era `15:1` or even the multi-decade-average `45:1` to `50:1`.
There is no academic consensus that the ratio has predictive validity for either future relative price movement or for absolute future price levels in either metal. The most rigorous treatments (Erb and Harvey's work on commodity price-anchoring, the multi-decade studies of commodity-pair regressions) treat the ratio as a regime-dependent descriptive variable with weak mean-reversion tendencies over very long windows and no useful predictive content over tradeable windows.
Practical takeaway: cite the ratio descriptively. 'The ratio currently sits at `82:1`, compared to a multi-decade average around `60:1`' is a defensible descriptive statement. 'The ratio's elevation suggests silver is poised to rally' is a forward-looking claim with no academic support and would be inappropriate for the editorial register this site maintains.
Reading the ratio against macro context
The ratio is useful as one input among many for understanding the relative-positioning of the precious-metals market against a macroeconomic backdrop. It is not the only input and is rarely the most important.
Structural drivers worth examining alongside the ratio: (1) the industrial-demand profile of silver versus gold — silver's industrial-demand half (electronics, solar, automotive) ties it more closely to the economic cycle than gold; (2) central-bank net buying — central banks buy gold materially more than silver (see /guides/central-bank-flows/), so structural central-bank demand tilts the ratio higher over time; (3) the ETF holdings profile — gold-backed ETFs are materially larger than silver-backed ETFs by AUM, with different flow profiles; (4) mining supply — silver is largely a by-product of copper, lead, and zinc mining (roughly `70%` of annual primary silver supply), making silver supply less responsive to silver-specific price signals than gold supply.
These structural drivers explain part of why the multi-decade ratio average sits well above the bimetallic-era `15:1`. The demonetization of silver in the 1870s eliminated the legal anchor; the modern structural drivers (central-bank gold preference, gold's monetary-asset standing without silver's industrial-cycle exposure) sustain a higher ratio than would prevail under a hypothetical bimetallic restoration.
For a buyer evaluating relative-position between gold and silver, the ratio alongside an honest reading of structural drivers gives more signal than the ratio alone. The /tools/gold-silver-ratio-chart/ provides the historical chart with primary-source citations; the /research/market-state/ hub covers the broader macro context including central-bank flows and ETF holdings.
How we sourced this
Historical gold-silver ratio data was compiled from the LBMA Gold Price and LBMA Silver Price published fixings from 1968 (the year of LBMA fixing modernization) to present, supplemented with pre-1968 reference prices from the Federal Reserve Bank historical-data series and contemporary monetary-history scholarship. The 19th-century bimetallic-ratio data draws from US Treasury Department annual reports and Milton Friedman's monetary-history work, particularly the discussion of the 1873 demonetization in 'A Monetary History of the United States.'
The Hunt Brothers' 1979-1980 silver-corner narrative and price data draws from CFTC enforcement records, the academic literature on the episode (notably Williams 1995), and the contemporaneous Wall Street Journal coverage. The 2008-2011 and 2020 price movements draw from continuous LBMA daily fixing data.
Academic treatment of the ratio's predictive validity (or lack of it) draws from Erb and Harvey's commodity-research papers and the broader literature on commodity-pair pricing. We deliberately avoid citing or relying on trading-newsletter or commodity-marketing claims about the ratio's forward-looking signal value.
In plain English
In plain English: divide the price of gold by the price of silver, get a number — that's the ratio. In the bimetallic monetary era it was anchored at 15:1 to 16:1. Modern multi-decade average is around 60:1. It spiked to 120:1 in March 2020 during pandemic liquidity stress. It is not a trading signal — academic research consistently fails to find that high or low readings predict future price moves. It is a descriptive snapshot. Cite it that way. The interactive chart at /tools/gold-silver-ratio-chart/ shows the full historical series with primary-source citations.
Want to talk this through? Book a 30-min research call →
Frequently asked questions
-
What is the gold-silver ratio?
The current spot price of gold divided by the current spot price of silver, expressing how many ounces of silver buy one ounce of gold. -
What was the historical ratio in bimetallic systems?
Roughly 15:1 to 16:1 under most pre-20th-century monetary regimes that legally tied gold and silver. The US Coinage Act of 1792 set the legal ratio at 15:1. -
What is the modern ratio range?
Late-20th-century range roughly 30:1 to 80:1. In March 2020 the ratio briefly exceeded 120:1 amid silver liquidity stress. Long-run modern average sits around 60:1 to 70:1. -
Is the ratio a trading signal?
No. Many practitioners cite it as a relative-value indicator, but it has no predictive validity established in academic literature. Describe, do not predict.
In plain English We're an editorial desk. Educational only — talk to a licensed adviser before doing anything with retirement assets.