Gold-silver ratio chart
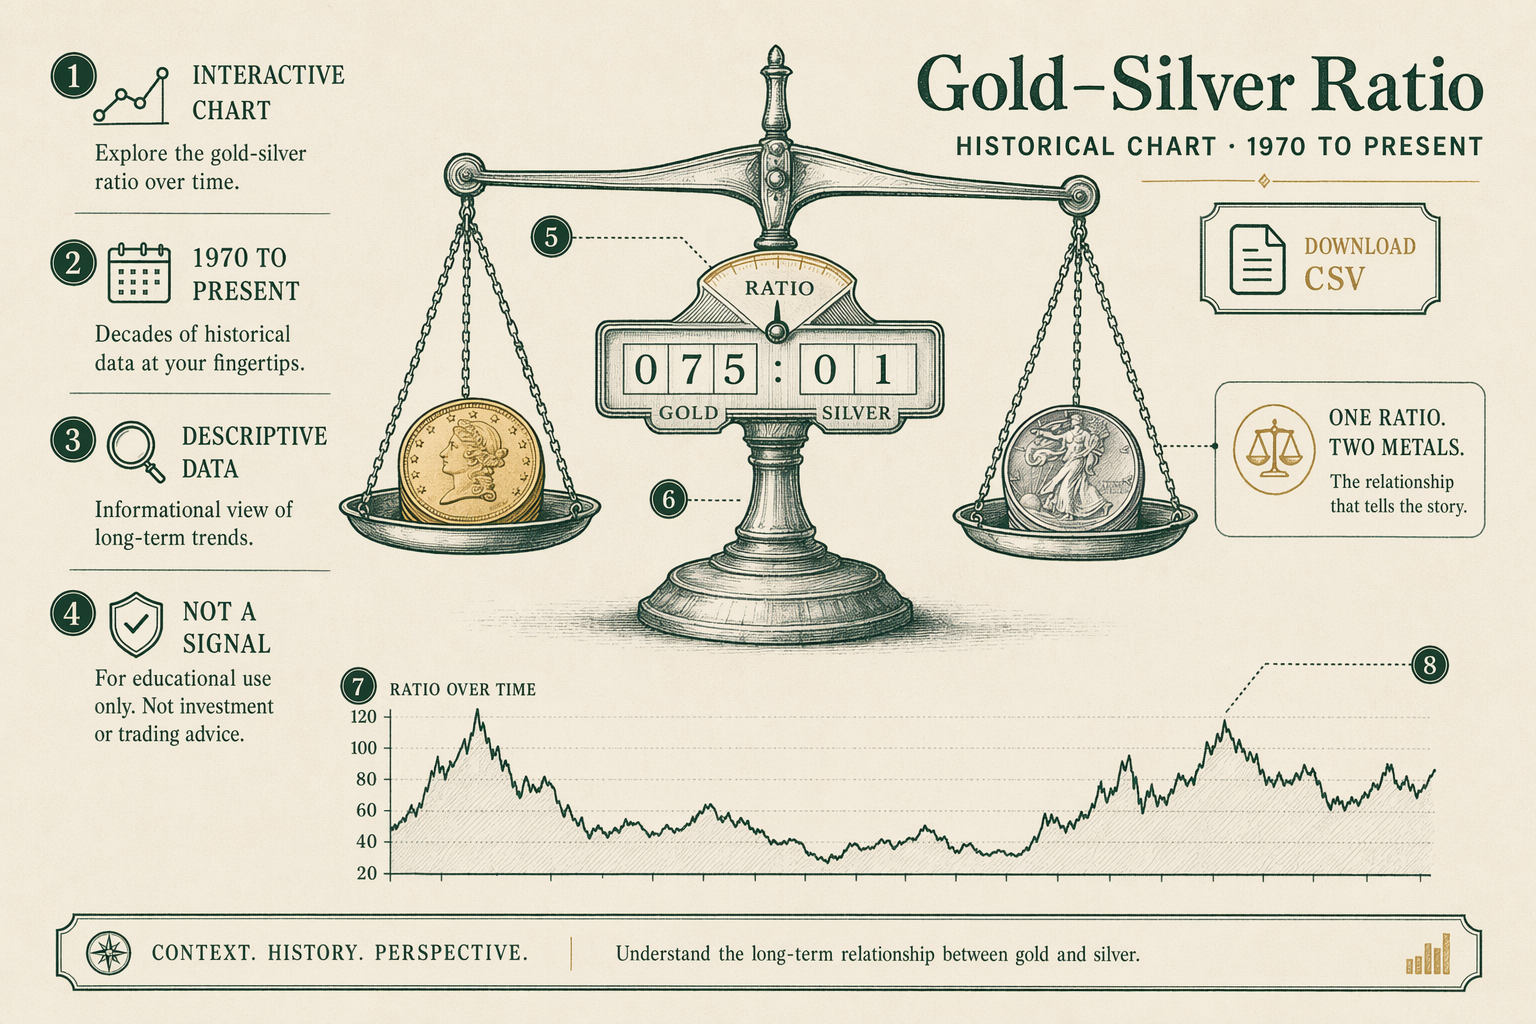
Interactive historical chart of the gold-silver ratio from 1970 to present, with download as CSV. Descriptive data, not a trading signal.
What the chart shows
The chart plots the daily gold-silver ratio from 1968 (the year of LBMA fixing modernization) through the most recent data refresh. The ratio is calculated as the LBMA Gold Price PM fix divided by the LBMA Silver Price daily fix, both quoted in US dollars per troy ounce.
Visible features in the chart: the 1979-1980 Hunt-Brothers-era compression to below `20:1` (the post-WW2 modern low); the early-1990s widening to above `90:1` during the low-silver-price period; the 2008-2011 compression to roughly `32:1` (the post-Hunt modern low); the March 2020 spike above `120:1` during COVID-onset liquidity stress; the rapid post-2020 normalization back to the `70:1` to `85:1` range that characterized 2022-2024.
The chart includes annotations for key inflection points and reference lines at the bimetallic-era benchmark (`15:1`) and the modern multi-decade average (`~60:1`). A snapshot-date band at the bottom shows the data range coverage.
The /guides/gold-silver-ratio/ topic-hub guide provides the analytical interpretation framework for what the ratio describes and what it does not predict. This page is the data-and-download companion.
Data sources
The underlying data is the LBMA Gold Price PM fixing series and the LBMA Silver Price daily fixing series, both retrieved from the LBMA's published archives. The LBMA Gold Price has been administered by ICE Benchmark Administration since March 2015; the predecessor London Gold Fixing series (1919-2015) is included for continuity. The LBMA Silver Price has been administered by CME Group and Thomson Reuters since August 2014; the predecessor London Silver Fixing series (1968-2014) is included.
Both series are the institutional-benchmark references cited by central banks, ETF rebalancing operations, and major institutional contracts. The data is the canonical reference for institutional-grade historical price analysis.
Currency: all data is in US dollars per troy ounce. The LBMA publishes simultaneously-set EUR and GBP fixings; those are not included in this dataset but are available directly from the LBMA's published archives for any reader who needs cross-currency analysis.
Refresh cadence: the dataset is updated quarterly. Each refresh adds the most recent quarter's daily fixings and verifies the historical series against the LBMA's reference archive for any retrospective corrections. The 'Last refreshed' date appears in the CSV header.
How to read the chart
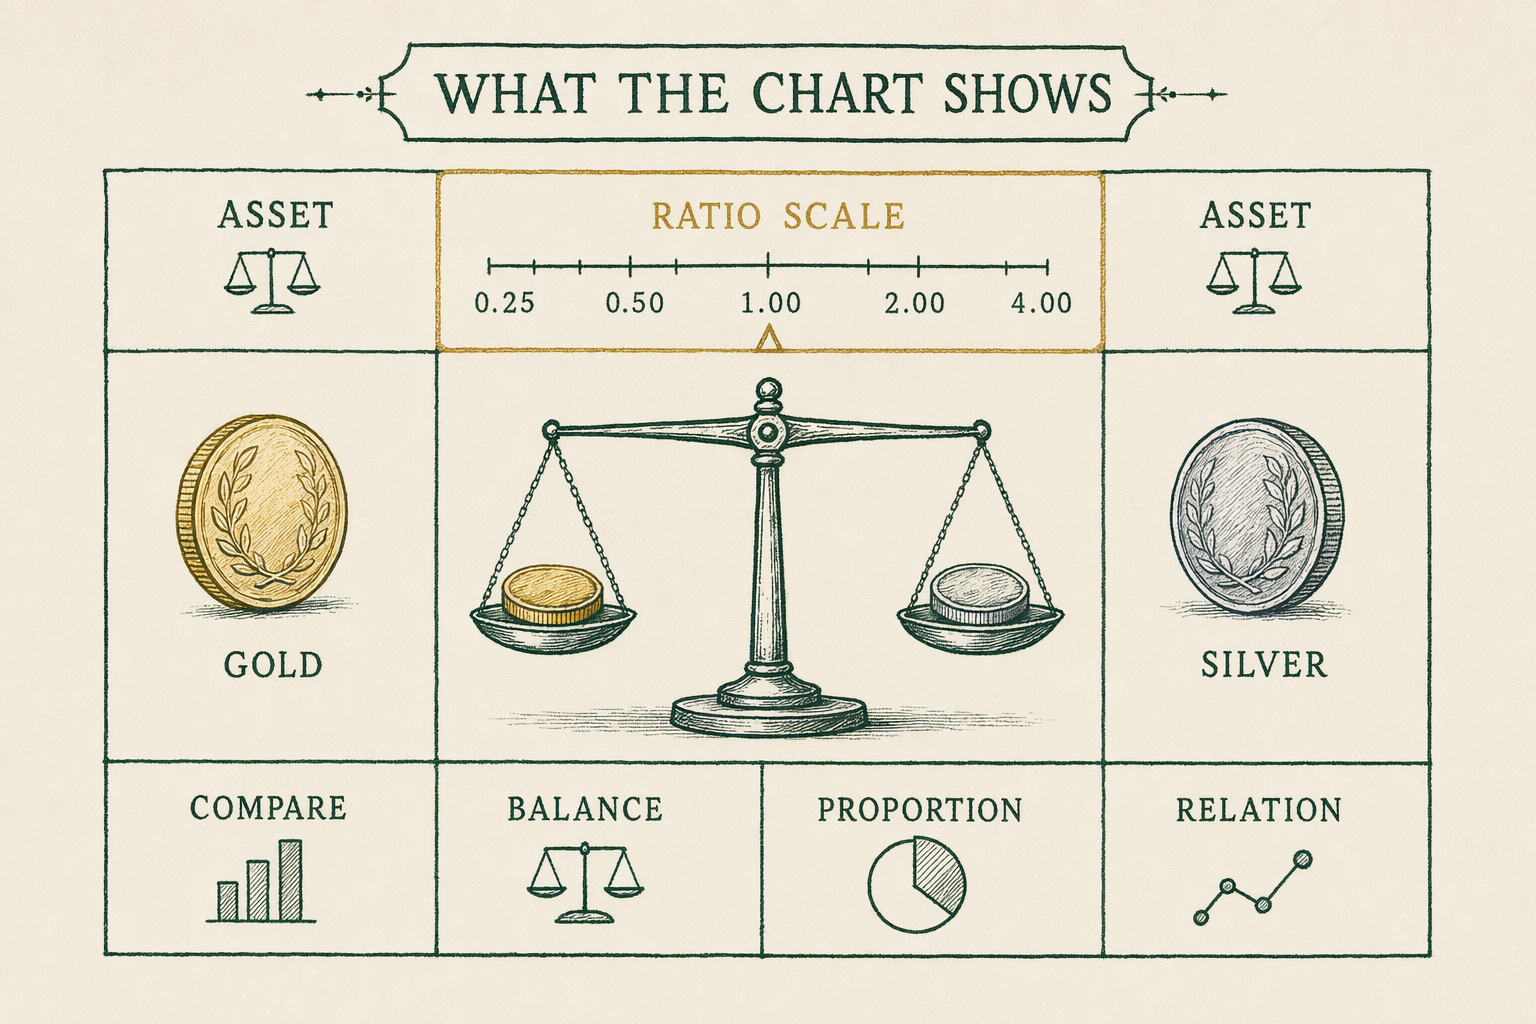
The Y-axis is the ratio value (ounces of silver per ounce of gold). Higher means silver is relatively cheaper compared to gold; lower means silver is relatively more expensive compared to gold.
The X-axis is the date, from 1968 through the most recent quarterly refresh. Hover (on desktop) or tap (on mobile) any point on the chart to see the date and ratio value for that day.
The dashed horizontal line at `60` is the modern multi-decade average. Readings above the line indicate silver is below its modern-historical relative-to-gold mean; readings below the line indicate silver is above its mean.
The dashed horizontal line at `15` is the pre-20th-century bimetallic-era benchmark, included for historical context. Modern readings have spent essentially no time near this level since the demonetization of silver in the 1870s.
Critical interpretive note: a high or low reading is not by itself a trading signal. The /guides/gold-silver-ratio/ guide discusses the academic literature on the ratio's predictive validity. Treat extreme readings as descriptive of where the two metals' price levels sit relative to each other at a moment in time, not as a forecast of where they will go next.
Download as CSV
Submit your email above to receive the full historical daily-ratio CSV by email. The CSV includes four columns: date (ISO-8601), gold price (USD/oz, LBMA PM fix), silver price (USD/oz, LBMA daily fix), ratio (gold/silver). Header rows include the data sources, the snapshot date, and the citation form to use if you republish.
The file is free to use for research, journalism, or analytical work, with attribution to bullionlens.com and the underlying LBMA sources. Please cite both when republishing.
The dataset includes approximately `14,500` daily observations across the 1968-present window — sufficient for multi-decade regression analysis, regime-change identification, or simple descriptive plotting. The CSV opens cleanly in Excel, Google Sheets, R, Python pandas, and Stata.
Limitations
This tool surfaces historical data; it does not provide investment advice. The chart shows where the gold-silver ratio has been, not where it is going. The /editorial-standards/ page documents our editorial policy on forward-looking content.
The ratio is one of many descriptive variables relevant to gold and silver market analysis. Other relevant variables include central-bank flows (covered in /guides/central-bank-flows/), real interest rates, the industrial-demand profile of silver versus gold, and the structural ETF flow data. The ratio alone gives an incomplete picture; the broader context lives in the /research/market-state/ hub.
The dataset reflects LBMA-fixing-based daily reference prices. Intra-day OTC market ratios can diverge from the published fix by small amounts; for trading-execution analysis the tick-data sources would be the appropriate reference (and are not free). For descriptive historical analysis the LBMA fix is the standard benchmark.
We do not provide trading signals, price predictions, or allocation recommendations based on this tool. Apply the data to your own analysis with appropriate professional advice (CPA for tax implications, licensed financial adviser for allocation decisions). In plain English: the chart shows you where the ratio has been across 60+ years. What that means for your portfolio is a conversation to have with a licensed adviser, not a conclusion to draw from a chart.
Gold-silver ratio chart
Frequently asked questions
-
What is the gold-silver ratio?
The current spot price of gold divided by the current spot price of silver, expressing how many ounces of silver buy one ounce of gold. -
Where does this data come from?
Historical LBMA Gold Price and LBMA Silver Price fixings, supplemented with pre-LBMA-fixing sovereign mint reference prices for early periods. Citations on the chart. -
Can I download the data?
Yes — a CSV download is available with the date and ratio columns. Free to use; please cite BullionLens if you republish. -
How do I use this tool?
Open the downloaded file, fill in the fields specific to your situation, and use the result as input to a conversation with a custodian or adviser. The tool surfaces the right questions; it does not generate personalized advice.
In plain English Drop your email and the brief lands in your inbox. We never sell your address.