Historical gold returns — downloadable reference
Free PDF reference of historical gold nominal and real returns across multiple rolling windows, with citation. Descriptive data, not predictions.
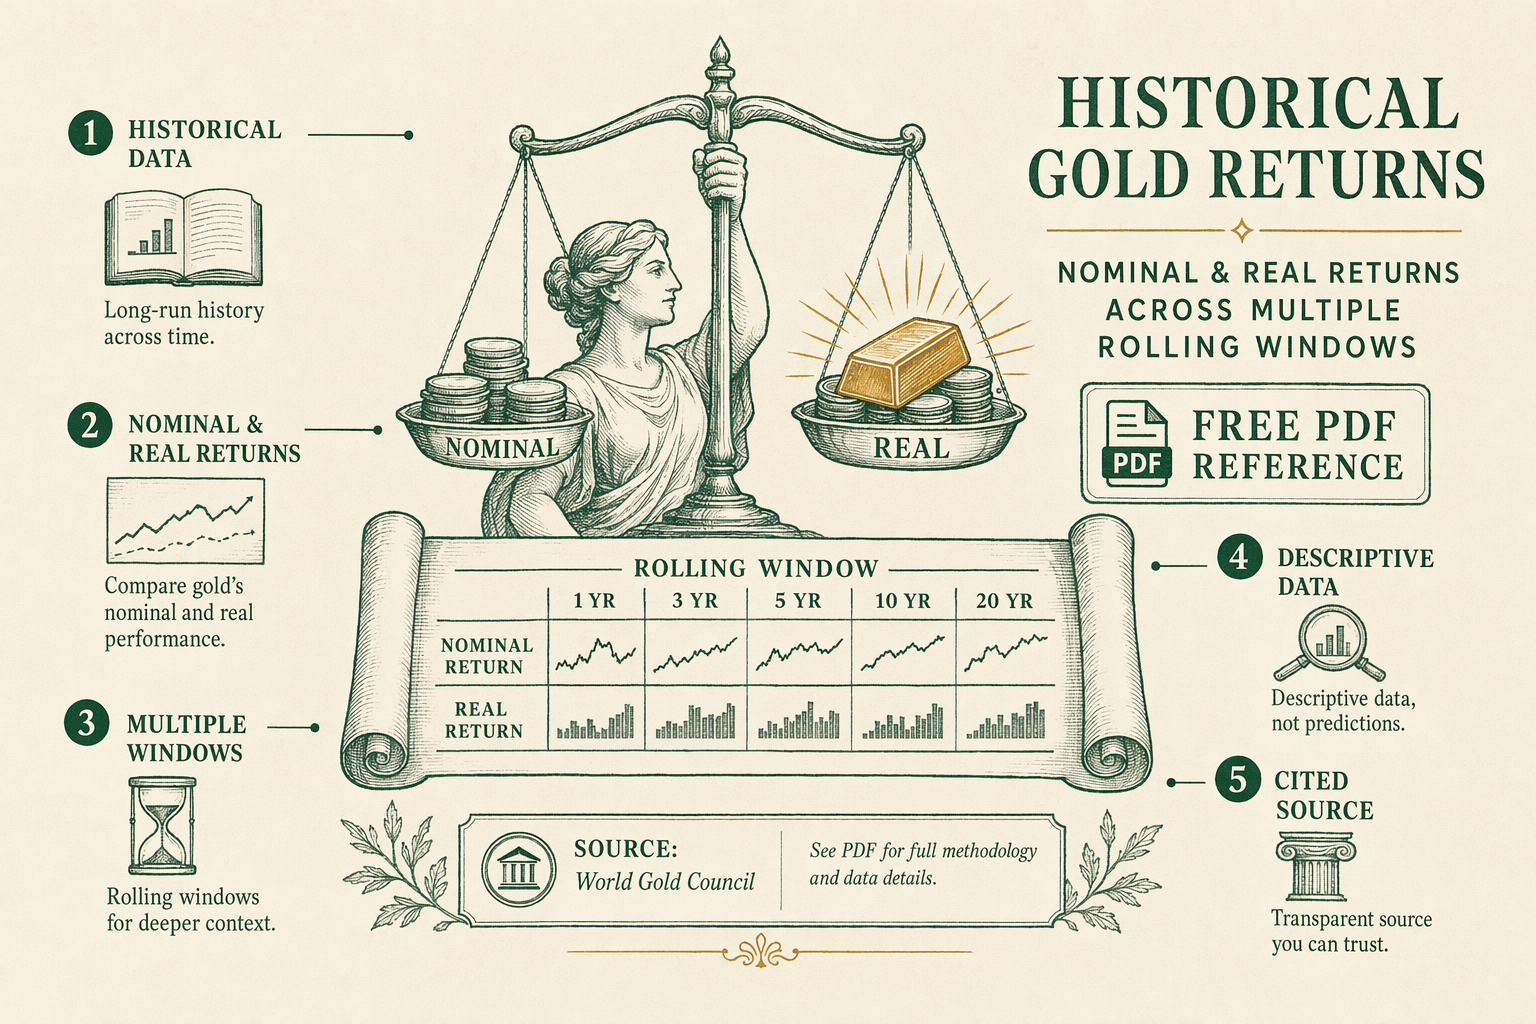
What the PDF contains
The PDF is a `16`-page reference document covering historical gold returns from 1971 (the end of US dollar gold convertibility under Bretton Woods) to the most recent year-end data. The format is structured as reference tables and accompanying chart panels rather than narrative prose — the document is designed to be a reference desk-side resource rather than a read-once article.
Page-by-page structure: annual gold returns table (1971-present, nominal and real); rolling 5-year returns table (annualized, in 5-year windows starting 1971); rolling 10-year returns table (annualized); rolling 20-year returns table (annualized); decade-by-decade summary statistics including mean, median, max-drawdown, and standard deviation; LBMA Gold Price PM-fix annual high/low/close table; methodology section describing the calculation framework and citations.
The data is presented in monospace numerics for clean side-by-side comparison. Reference lines and annotations highlight the most-cited inflection periods: 1971-1980 (post-Bretton-Woods rally), 1981-2000 (the multi-decade consolidation), 2001-2011 (the multi-year secular rally), 2012-2018 (the post-rally consolidation), 2019-2024 (the structural-shift period).
Citation-density is high: every table cites its primary source (LBMA, BLS CPI data, World Gold Council aggregations where used). The methodology section walks the calculation of nominal-to-real conversion using monthly CPI-U from the Bureau of Labor Statistics.
Data sources
Gold prices: LBMA Gold Price PM fix in USD per troy ounce, retrieved from the LBMA's published archives. Pre-LBMA-fixing (1968-2015 covers the LBMA fix; 1919-1968 uses the predecessor London Gold Fixing) data is sourced from the Federal Reserve Bank historical-data series and the World Gold Council's reference archives.
Inflation adjustment: US Bureau of Labor Statistics Consumer Price Index for All Urban Consumers (CPI-U), all-items, retrieved monthly. Real-return calculations use the standard formula (1 + nominal) / (1 + inflation) - 1.
Calendar conventions: annual returns are calculated end-of-year to end-of-year using December PM fix prices. Rolling-window returns are calculated using continuous end-of-year prices with overlap. The methodology section in the PDF documents the specific calculation steps so any reader can reproduce the figures.
Refresh cadence: the PDF is updated annually after the December LBMA Gold Price PM fix and the December CPI-U release. Each refresh extends the data series by one year and verifies the historical series against the LBMA's reference archive for any retrospective corrections.

Nominal vs real returns
The distinction matters for long-horizon gold analysis. Nominal returns are the change in dollar-price terms — useful for cash-flow analysis but uninformative about purchasing-power preservation. Real returns deduct inflation from nominal returns, expressing the change in purchasing-power terms.
Indicative summary from the reference (full data in the PDF): • 1971-1980 nominal annualized: approximately `+30%` per year. Real annualized: approximately `+21%` per year (high-inflation 1970s). • 1981-2000 nominal annualized: approximately `-3%` per year. Real annualized: approximately `-6%` per year (disinflation period; gold underperformed cash). • 2001-2011 nominal annualized: approximately `+18%` per year. Real annualized: approximately `+15%` per year (post-9/11 secular rally). • 2012-2018 nominal annualized: approximately `-2%` per year. Real annualized: approximately `-3%` per year. • 2019-2024 nominal annualized: approximately `+12%` per year. Real annualized: approximately `+8%` per year.
Multi-decade aggregates: 1971-2024 (full 54-year window) nominal annualized approximately `+8%` per year, real annualized approximately `+4%` per year. The real annualized return is positive but materially lower than US equities over the same window (`~6%` to `7%` real annualized for the S&P 500).
Gold's real-return profile is decidedly regime-dependent. The 1970s and post-2001 periods produced strong real returns. The 1981-2000 disinflation period produced negative real returns. Treating the full-window average as the forward expected return ignores the regime-dependence and is likely to mislead.
Rolling 5/10/20-year windows
Rolling-window analysis shows how the returns experience would have varied based on entry and exit timing. A buyer who entered gold in 1971 and held for 10 years experienced very different results than one who entered in 1981 and held for 10 years. The PDF includes structured tables for both 5-year and 10-year rolling windows across the full 1971-2024 history.
Highlights from the rolling-window data (full tables in the PDF): • 10-year rolling nominal returns range from `-2%` annualized (worst 10-year window, 1981-1991) to `+25%` annualized (best 10-year window, 1971-1981). • 10-year rolling real returns range from `-7%` annualized (worst) to `+19%` annualized (best). • 20-year rolling nominal returns range from `+3%` annualized (worst) to `+12%` annualized (best). • 20-year rolling real returns range from `-2%` annualized (worst) to `+8%` annualized (best).
The 20-year window data shows that even at multi-decade horizons gold has at times produced negative real returns. The historical record does not support a claim that gold reliably preserves purchasing power on any specific multi-decade window; it shows that gold has done so in some windows and not others.
Practical implication for forward thinking: entry timing matters more for gold than for many other asset classes due to the regime-dependence of its real-return profile. The PDF's rolling-window data lets a reader see the entry-timing sensitivity directly rather than relying on a single point-estimate average.
What this does NOT forecast
The PDF documents what happened — it does not predict what will happen. Forward expected returns depend on factors (inflation regime, real-rate path, central-bank-flow continuation or reversal, currency dynamics, regulatory environment) that may differ materially from any historical window.
We deliberately do not extrapolate. Multi-decade averages are useful descriptively but are poor forward forecasts when the underlying regime is uncertain. The /case-studies/2024-spot-price-decoupling/ case study covers an explicit example of how a historically-good gold-price model under-predicted the actual 2024 price action — a useful caution against treating historical analysis as forward inference.
The PDF is appropriate for: understanding historical context, calibrating expectations against multi-window data, supporting a conversation with a licensed adviser about allocation framing. It is not appropriate for: forecasting returns over a specific future window, sizing positions based on historical averages, or making trading decisions in either direction.
Historical gold returns — downloadable reference
Frequently asked questions
-
What time period does the reference cover?
1971 (end of US dollar gold convertibility) to present, in annual increments, with rolling 5/10/20-year return tables. -
Are returns adjusted for inflation?
Yes — both nominal and real (CPI-adjusted) return columns are provided. -
How do I use this tool?
Open the downloaded file, fill in the fields specific to your situation, and use the result as input to a conversation with a custodian or adviser. The tool surfaces the right questions; it does not generate personalized advice. -
Can I share the download?
Yes, with attribution to bullionlens.com. The methodology and citations inside the document are what give it weight; remove either and downstream readers lose the source-of-truth trail.
In plain English Drop your email and the brief lands in your inbox. We never sell your address.